Showing posts with label Ethiopian DNA. Show all posts

Saturday, June 6, 2015

More Ethiopian Uniparental Data (More resolution.. less clarity)

A new paper attempting to decipher the out of Africa exit route by focusing on Ethiopian and Egyptian autosomal genetics was published a couple of weeks ago. Putting aside the 'hocus pocus' autosomal analysis for a moment, I was quite intrigued by the more concrete uniparental relative frequency images published in the supplemental material, not a lot of clarity is attached with these images however as the actual numbers are not given.


Note that the phylogeny they reference for the results here, is from Phylotree Y.

Below I have attempted to interpret some of the colors from the image into Numerical approximations, note these are only approximations and not a substitute for the real data, of which I am not privy to.


Amhara Eth Somali Gumuz Oromo Wolayta
A-M13 27% 0% 55% 19% 48%
B-M150 0% 0% 4% 0% 0%
B-M8495 0% 0% 35% 0% 0%
E-M96 3% 4% 0% 6% 12%
E-M215 3% 0% 0% 0% 0%
E-V22 9% 0% 0% 5% 3%
E-Z1902 8% 80% 4% 20% 0%
E-Z830 0% 0% 0% 0% 3%
E-M34 3% 0% 0% 5% 13%
EM4145 17% 0% 0% 25% 20%
J 25% 11% 0% 19% 0%
T 3% 4% 0% 0% 0%

A-M13 :

The prevalence of this haplogroup in Ethiopia has always been known to us, however the extremely high frequency in the Wolayta is quite a surprise, this could be due to the relatively small sample size however, as the much higher sample size of the Wolayta found in the Plaster thesis, only showed 13% of A-M13.

B-M150 and  B-M8495 :

Only found in the Gumuz, we have known for a while that B is not prevalent at all in the wider Ethiopian population, rather it is a continuation of the much larger B frequencies found in Niloitic Sudan. Still, it is good to see a finer resolution of B, and that the majority of B clades in Ethiopia belong to the small B-M8495 branch.

E-M96:

This could potentially be a wide variety of things, but my money would be on E-M329, sister clade to E-M2 and  child clade of E-V38, which in turn is a sister clade to E-M215, the most prevalent YDNA lineage in Ethiopia.

E-M215

As this is showing only in Northern Ethiopia, I would think it maybe E-V92, it still could however be a basal "E3b" lineage.

E-V22

A variant of E-M78, this lineage has always been found in low amounts in Ethiopia, with moderate amounts in Sudan and Egypt.

E-Z1902

This is a lineage that is found downstream of E-M78, but unites E-V12 with E-V65, which means the results would include E-V32 , a sublineage of E-V12 and the most frequent YDNA lineage in Somalis, I would wager that all of the E-Z1902 is actually E-V32, since E-V65 has never been found in Ethiopia thus far. There is a chance that some E-V12* could be in the mix as well.

E-Z830

This lineage has been discussed before, it unites many lineages in Ethiopia, including E-M34,E-M293 and E-V42. It looks like they did not test for E-V42 from the image however, so it could be E-V42.

E-M34

The prevalence of this lineage in southern Ethiopia from the image above, could be further confirmation of the high frequency of E-M34 found in the omotic speaking Maale from the plaster thesis.

EM4145

This is a tricky one, I am not sure what it is , I have searched for SNPs named as such and came back empty handed, to complicate things further, it is shaded a similar color as E-M293, but I discounted that lineage based on the fact that the lineage they report here is found in relatively high frequency in Ethiopia, whereas previous data shows that E-M293 is only found in low to moderate  frequencies in Ethiopia. My best guess for this SNP would be something equivalent to E-V6, if not that then E-P2(x E-M215), but with less confidence for the latter, as if that was the case, I would think they would have given it a more basal presence in the hierarchy of YDNA lineages from the image above.

J and T

These F belonging lineages look both to be inline with what we already know in terms of frequency distribution throughout Ethiopia.

refs:
http://ethiohelix.blogspot.com/2010_12_01_archive.html
http://ethiohelix.blogspot.com/2012/01/e1b1b-update.html 
http://ethiohelix.blogspot.com/2012/11/extensive-doctoral-thesis-on-ethiopian.html
http://ethiohelix.blogspot.com/2013/05/another-extensive-thesis-on-east.html

Update 06/07/2015 - MTDNA

Friday, February 21, 2014

YDNA E-M123; A closer look

E-M123 (as well as E-M34) was first discovered by Underhill(2000) and is found with a low to medium frequency distribution in East Africa and the Middle East, while it has a low frequency distribution in North Africa and Europe.

Phylogeny:
Figure 1 - Current and previous E-M215 phylogenetic structure 

Figure 1 shows a comparison of the basic phylogeny of E-M215/M35 as was known before 2011 (a) and after (b), with a 'who and when' key for the Discovery of the UEPs. Notice the impact the rearrangement has on the phylogenetic placement of E-M123, specifically the fact that E-M123 is shown to have a more recent common ancestor with the East and Southern African variants of E-M35, i.e. E-V42 and E-M293, before it does with any of the other variants of E-M35.

Previous publications:

While it is unfortunate that all of the research that has previously been published on E-M123 was done under the consideration of the older (and rather out of date) configuration of the basic structure of E-M35, it is still worth while to look at articles that have tried to untangle the origins and history of this lineage, of these, 3 come to mind:

Tuesday, May 7, 2013

Analyzing YDNA A-M13 lineages in Ethiopian linguistic groups

Similar to the previous analysis of J lineages found in Ethiopia from the Plaster paper, the other prevalent lineage in Ethiopia, A-M13 (formerly known also as A3b2), is also analyzed below. A total of 616 A-M13 lineages were reported in the study, of which ~32% were classified as Semitic speakers, ~40% as Cushitic speakers, ~17% as Omotic speakers and the remainder within the Nilo-Saharan speaking macro-phylum.

Wednesday, May 1, 2013

Analyzing YDNA J lineages in Ethiopian linguistic groups

The extensive YDNA dataset found in the Plaster paper has a total of 691 YDNA lineages that belong to haplogroup J, although there is no more detailed SNP resolution reported for most of these lineages, it is safe to assume, from previous data on Ethiopia, that a vast majority of them would belong to J1-M267. There is a limited set of STR data that accompanies these lineages as well, namely only for the markers; 19, 388, 390, 391, 392 and 393.

According to the report, J lineages are proportionally found higher in Semitic speakers in Ethiopia, ~21% ,followed by Omotic speakers at ~ 12% and Cushitic speakers at ~  8%.  Out of the 691 YDNA J lineages reported, 259 were Semitic speakers, 266 spoke some type of Omotic language and most of the remainder spoke Cushitic languages.

Monday, February 4, 2013

A speculative superimposition of E-M35 variants onto Afroasiatic.

Here is a speculative superimposition of the variants of YDNA E-M215/M35 (E1b1b/1) onto an Afroasiatic internal classification, Lionel Bender's (1997) classification. 


The red question marks represent a less unsure fit.

Monday, January 7, 2013

East African mtDNA variation has implications on the origin of Afroasiatic

The Dienekes' Anthropology Blog shows a new paper on East African mtDNA with implications for the origin of Afroasiatic, namely with the citing: "making the hypothesis of a Levantine origin of AA unlikely",  unfortunately I do not have access to the paper, I would greatly appreciate if anyone has access to it to please send me a copy here: ethiohelix@gmail.com.

Here is the abstract and the link:


Abstract

East Africa (EA) has witnessed pivotal steps in the history of human evolution. Due to its high environmental and cultural variability, and to the long-term human presence there, the genetic structure of modern EA populations is one of the most complicated puzzles in human diversity worldwide. Similarly, the widespread Afro-Asiatic (AA) linguistic phylum reaches its highest levels of internal differentiation in EA. To disentangle this complex ethno-linguistic pattern, we studied mtDNA variability in 1,671 individuals (452 of which were newly typed) from 30 EA populations and compared our data with those from 40 populations (2970 individuals) from Central and Northern Africa and the Levant, affiliated to the AA phylum. The genetic structure of the studied populations—explored using spatial Principal Component Analysis and Model-based clustering—turned out to be composed of four clusters, each with different geographic distribution and/or linguistic affiliation, and signaling different population events in the history of the region. One cluster is widespread in Ethiopia, where it is associated with different AA-speaking populations, and shows shared ancestry with Semitic-speaking groups from Yemen and Egypt and AA-Chadic-speaking groups from Central Africa. Two clusters included populations from Southern Ethiopia, Kenya and Tanzania. Despite high and recent gene-flow (Bantu, Nilo-Saharan pastoralists), one of them is associated with a more ancient AA-Cushitic stratum. Most North-African and Levantine populations (AA-Berber, AA-Semitic) were grouped in a fourth and more differentiated cluster. We therefore conclude that EA genetic variability, although heavily influenced by migration processes, conserves traces of more ancient strata. Am J Phys Anthropol, 2013. © 2013 Wiley Periodicals, Inc.

mtDNA variation in East Africa unravels the history of afro-asiatic groups

UPDATE: Ok, got it, this was a nice little article to read, however with respect to the implications of East African mtDNA variation on the origin of Afroasiatic, it did not offer nothing really substantially new, in terms of material evidence, that any reasonable person that has read up on this subject a little bit would not have known beforehand, namely:


Concerning the third point, i.e., the place of origin of AA (EA or the Levant), our results do not allow us to make conclusive statements. Indeed, coalescent simulations of different genetic parameters (Supporting Information Fig. 4) according to the two mentioned hypotheses show that—even assuming complete correlation between languages and mtDNA variability—their confidence intervals largely overlap. Thus, we limit ourselves to the following observations. First, EA shows the highest levels of nucleotide diversity among the studied populations with a decreasing cline towards NA and the Levant (Supporting Information Fig. 1 and Supporting Information Table 1). This is true not only for the Ethiopian cluster A, but also, and especially, for groups belonging to clusters B1 and B2. Second, EA hosts the two deepest clades of AA, Omotic and Cushitic. These families are found exclusively in EA, while the presence of Semitic in this area is much more recent. Third, cluster C – collecting Berber- and Semitic-speaking populations from NA and the Levant – shows only modest signals of admixture with clusters A and B (Fig. 2, Supporting Information Table 1). None of these points,
taken by itself, is conclusive, but undoubtedly the hypothesis of origin of AA in EA is the most parsimonious one, if compared to the Levant.

It did also have some very nicely made contour maps for EA, as well as detailed mtDNA haplogroup assignments for some 30 or so East African groups, which I will make an interactive chart for within the next couple of days.

UPDATE2 (01/08/2013): mtDNA haplogroups (46) in 31 groups.

A note on the sources for the samples listed above:


The Dinka Samples are from Krings etal. (1999)
The Sudan and Ethiopia Samples are from Soares et al. (2011)
The Tigrai, Amhara, Gurage, Oromo and Yemeni1 Samples are from Kivisild et al. (2004)
The Beta Israel Samples are from Beharet al. (2008)
The Ethiopian Jewish Samples are from Non et al. (2011)
The Somali Samples are from Soares et al. (2011) and Watson et al. (1997)
The Daasanach and Nyangatom Samples are from Poloni et al. (2009)
The Turkana2 Samples are from Poloni et al. (2009) and Watson et al. (1997)
The Nairobi Samples are from Brandstatter et al. (2004)
The Kikuyu Samples are from Watson et al. (1997)
The Hutu Samples are from Castrì etal. (2009)
The Iraqw Samples are from Knight etal. (2003)
The Burunge and Turu Samples are from Tishkoff et al. (2007)
The Datoga and Sukuma Samples are from Tishkoff et al. (2007) and Knight etal. (2003)

All the remaining samples: Dawro Konta, Ongota, Hamer, Rendille, Elmolo, Luo, Maasai, Samburu and Turkana are new and sampled along with this study.

Saturday, January 5, 2013

TMRCA calculations from Plaster NRY data : Correcting an Error


Previously, I had computed TMRCAs for the YDNA STR data from the additional material that was provided along with Dr.Chris Plaster's thesis. However, after a brief communication with the author, I found out that the marker order of the STRs in the excel file was reported wrongly, the correct order for the markers are thus as follows:

DYS19 DYS388 DYS389I DYS389II DYS390 DYS391 DYS392 DYS393 DYS437 DYS438 DYS439 DYS448 DYS456 DYS635 Y GATA H4

This changes my TMRCA calculations because I am not computing the coalescent using a generic mutation rate that is equivalent for all the markers, but rather each marker has its own mutation rate attributed to it.

When I rerun my program using the newly corrected order above I get the following:


As can be seen, using the new order of markers generally reduces the number of generations to coalescent for the Plaster data-set. The previous observation of a relatively lower TMRCA for the haplozone data of E-M123 versus that of the E-M34 Plaster data-set largely disappears. 

To check if the fact that the high number of samples (129) present in the E-M123 haplozone data-set was skewing the results, I took 23 random samples (which equals the same number of samples available in the Plaster E-M34 data-set) from the larger E-M123 Haplozone dataset and re-run the TMRCA calculations on just those samples, I repeated this process 300 times, only 28% of the runs yielded a mean TMRCA less than the E-M34 Plaster data-set, if sample size was skewing the results I would expect >50% of the runs to have a mean TMRCA less than that of the E-M34 plaster dataset.

That said, the E-M34 Plaster data-set still had a relatively higher generations to coalescent than the E-M84 Haplozone dataset, E-M84 is a subclade of E-M34 and a high majority of haplotypes that belong to E-M34 also test positive for the E-M84 SNP (at least for the non-African E-M34 haplotypes that we know of).

Other than that, the new, and corrected, ordering of the markers did not have much impact in relative TMRCA terms between the Plaster and Haplozone/FTDNA data for the other lineages I had tested.

Monday, November 26, 2012

Extensive Doctoral Thesis on Ethiopian Y and mtDNA

I was contacted earlier by Dr. Chris Plaster about a doctoral thesis on Ethiopian Y & mtDNA that was completed 2 years ago but had been embargoed to the public until only about two months ago. As this is the first time I am coming across of it, plus since it is 204 pages long I have not had a chance to go through it thoroughly, but suffice it to say that this is the most extensive work on Ethiopian NRY & mtDNA that I have seen to date, although the resolution leaves a lot to be desired, I will update this post more as I read it more thoroughly over the next few days/weeks...


Variation in Y chromosome, mitochondrial DNA and labels of identity on Ethiopia


Some numbers and figures that caught my attention at first glance:


The Discussion section also has some interesting things to say, especially with respects to haplogroups A3b2 and J, but also the remaining ones found in Ethiopia as well.

Wednesday, November 14, 2012

STRUCTURE run on High/Low Altitude Ethiopians


The pdf can be downloaded here

Regarding the populations sampled, the paper notes the following:

The high altitude (HA) Amhara are agropastoralists living in a temperate Afro-alpine ecosystem in the Simien Mountains National Park at altitudes ranging from 3500-4100 meters (m). Altitudes above 2500m on the East African Plateau have been inhabited for at least 5 thousand years (ky) and altitudes around 2300-2400m for more than 70ky [24,25].”

Plus:

DNA was extracted from blood samples provided by 192 Amhara individuals living at 3700 m in the Simien Mountains National Park or at 1200 m in the town of Zarima.”

For the Oromo:

The HA Oromo are pastoralists herding cattle, sheep and goats and living in a temperate Afro-alpine ecosystem in the Bale Mountains National park and reside on the Sanetti Plateau at 4000-4100m. The HA areas of the Bale Plateau have been inhabited by Oromo since the early 1500s according to historical records [22,23].”

Plus:

79 individuals lived at 4000 m in the Bale Mountains National Park while 39 individuals lived at 1560 m in the town of Melkibuta.”

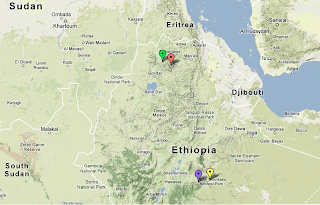
Melkibuta is probably a typo for Melkabuta, Bale, close to Goro, Bale which I have used as a proxy town in the map below for the location of the LA Oromo samples. 
Green= Low Altitude Amhara, Orange = High Altitude Amhara , Yellow = Low Altitude Oromo, Purple = High Altitude Oromo


Regarding the STRUCTURE run it says:

This position is further supported by the Bayesian clustering analysis performed using the program STRUCTURE [85]. In this analysis, 3 different sets of 57652 SNPs were used to infer the ancestral composition of each population assuming 7 ancestral groups. The STRUCTURE plots clearly show that Ethiopian populations share ancestral components with sub-Saharan African and Middle Eastern populations falling in the middle of the ancestry gradient between these two groups of populations (Figure S2.”

and Interestingly:

We also calculated the haplotype diversity and compared it to that observed in the worldwide populations. Interestingly, the Oromo (0.822) and Amhara (0.810) haplotype diversity values are as high as or higher than the highest values [80] observed in the HGDP, i.e. Bantu (0.818), Biaka Pygmies (0.815), Yoruba (0.815) and Mandenka (0.807); this is true regardless of altitude (0.798 for HA Amhara; 0.803 for LA Amhara, 0.813 for HA Oromo, and 0.813 for LA Oromo).”


There is also an FsT based Global neighbor joining tree in the PDF with a familiar outcome.


Saturday, August 18, 2012

Anuak YDNA

Low resolution Anuak YDNA from Naser Ansari Pour et. al,

I expect the BT*(xDE,KT) to be likely haplogroup B-M150 for the most part.

E1b1a7, is old nomenclature from 2010, with the defining SNP for the lineage being M191/P86, the newer nomenclature for this lineage is E1b1a1a1f1a. Similarly, A3b2 is an older nomenclature for the lineage defined by the SNP M13, the newer nomenclature is A1b1b2b.

Saturday, July 7, 2012

The World At K=2


The most basic Autosomal genetic division of the world is between Africans and Out of Africans (OOA), this is not only seen on global PCA or MDS maps , where the first PC separates Africans from non Africans, but can also be observed with model based statistical (Bayesian) Analysis as well, where the first model iteration, i.e. K=2 distinguishes Africans from non-Africans.
Here, I present (for reference) the full ADMIXTURE, K=2 results for a global dataset of 2,967 individuals from around the world, sampled for 16,595 SNPs with a total genotyping rate of 99.6%.

The results are arranged from the highest median African % to the lowest.

Friday, June 22, 2012

Intra African Genome-Wide Analysis, V2

See Also : Intra African Genome-Wide Analysis, V1


Population References and First Pass K10 Analysis


K2 - K10 Analysis

Friday, March 16, 2012

Introducing Yemenis into the Afrasan dataset.


This is about an observation made when I introduced the Yemenis (from Behar (2010)) into an ADMIXTURE analysis of the Afrasan Dataset (x Mozabites)

Monday, March 12, 2012

TreeMix analysis on the African Dataset


Thanks to a commenter going by the moniker 'Eze', who notified me the other day of a new program called Treemix, in which it infers “patterns of population splitting and mixing from genome-wide allele frequency data”, I had a chance to give it a try on the Intra-African Dataset that I have described previously.

After converting the input file into the desired format, I decided to play with several of its functionalities to become familiar with it,
 
1) Default Maximum Likelihood (ML) Tree,


2) Default ML graph with 4 assumed migrations,


 3) ML graph rooted with the San-nb,

  
4) ML graph with 4 migrations and rooted with the San-nb.

A remaining option of the software that I have not as yet tried is that which groups SNPs together to account for linkage disequilibrium. 

Other than that, the results are quite as expected, the North Africans are shown in both the default and rooted trees, but especially with the San-n rooted tree, as a branch of East Africans, and where East Africans in turn are seen as a branch of other Africans, consistent with evidence from uni-parental markers, as well as published papers, for an East African genesis of Eurasians, of which North-Africans can be used as a proxy for this particular Dataset.

The 4 inferred migrations in order of decreasing edges were;

-(Biaka Pygmy, Ancestral Sotho/tswana) → Sandawe, Migration edge:0.457032; likely an old hunter gatherers link. This was noted by Tishkoff (2009) : “These results suggest the possibility that the SAK, Hadza, Sandawe, and Pygmy populations are remnants of an historically more widespread proto-Khoesan- Pygmy population of hunter-gatherers.”

-(!kung,Ancestral to Biaka and Mbuti Pygmies) → Hadza,
Migration edge:0.44087; potentially another early hunter gatherers link.

-Ethiopian Jews → San,
Migration edge:0.188914; this could be a relic of early hunter-gatherer connections with Ethiopia (See: Ethiopians and Khoisan share the deepest clades of the human Y-chromosome phylogeny.) Another possible connection for this could be the migration of YDNA E1b1b1b2b (E-M293) carriers from Eastern Africa to Southern Africa within the past few millennia.

-Mbuti Pygmy → Alur,
Migration edge:0.140627; this was also picked up by the ADMIXTURE analysis, where the Alur had significant amounts of Mbuti and Biaka pygmy components.

Further reading on the details behind the software featured in this post, TreeMix, can be found here: http://hdl.handle.net/10101/npre.2012.6956.1.


UPDATE: Run another one again rooted with the SAN from Namibia and 10 migrations assumed and got the following results, left column is Migration edge weight

0.586693 luhya →hema,hadza
0.508001 egyptans → EtA
0.504407 egyptans → EtT
0.442291 egyptans → Ethiopian-jews
0.432858 moroccans → fulani
0.27746 mbutipygmy,pygmy → sandawe
0.203223 mbutipygmy,pygmy → hadza
0.156929 egyptans → maasai
0.154406 moroccans → san
0.129901 pygmy → alur


Some of the results from the previous 4 assumed migrations run disappeared, it is not clear if migrations inferred from a lower m assumption are more statistically significant than those inferred from higher m assumptions. In general, this newer run resembles more of the K10 ADMIXTURE run, however there are some obscure differences, for instance, while it picked up a North to East African migration in the EtA, EtT and EtJ samples, it skipped the EtO samples and then picked up the same migration pattern in the maasai samples, whom had a lower 'North-African' component in the K10 ADMIXTURE run than the EtO samples. My take on this is that the program is not yet sophisticated enough to accommodate for bidirectional migrations that have happened for thousands of years, like the ones that have taken place between East and North Africa for instance. Indeed the authors of the software do list the following pertinent point as one of their assumptions:

"We also have modeled migration between populations as occurring at single, instantaneous time points."

and

"This model will work best when gene flow between populations is restricted to a relatively short time period. The relevance of this assumption will depend on the species and the populations considered."

UPDATE2: Residual plot for 10 migrations rooted with the San-nb.

Thursday, March 8, 2012

Afrasans in a Genome-Wide context.


A subset of the Intra-African dataset I have includes Afrasans, or Afroasiatic speakers. Afroasiatic is typically divided into 6 major categories or groups; Semitic, Berber, Egyptian, Chadic, Cushitic and Omotic. A 7th, but nearly extinct group, known as Ongota is contentious, but is by some included as its own branch within the Afroasiatic phylum. All of these Language groups, with the exception of Semitic, are exclusively found in Africa. The 211 Afrasan samples in the dataset belong to 4 or 5 of those groups mentioned, depending on how one accounts for any language shifts (that is shifts within the wider Afrasan phylum) that might have occurred. A rough table is shown below associating the 211 samples with current, and in some cases previously spoken language or language groups of Afroasiatic.

 
In general, Afroasiatic is thought to have emerged somewhere in the North Eastern section of Africa, anywhere from Ethiopia to Southern Egypt, in the genetic (Autosomal) sense, this area can perhaps be viewed as where such populations inhabiting that area in Africa, lie along a diagonal axis of the C1 vs C3 Intra- African MDSplot (at ~ 34°
from the horizontal), as highlighted below:
MDS plots
After extracting the 211 AA speaking samples from the 1065 sample African Dataset, I performed an MDS Analysis on it as seen below.
Component 1 separates Berber/Semitic/Egyptian speakers from Chadic speakers, with Ethiopian Semitic/Cushitic speakers plotting somewhere in between, but closer to the former in this separation. Component 2, separates Ethiopians+Egyptians from the rest.
 
Component 3 Separates the Mozabites from the Rest, with Ethiopians again retaining an intermediate position.

Model Based Analysis
The Logical value for a K selection would be 6, i.e. equivalent to the number of known Afroasiatic subgroups, however, since Omotic speakers are not present in the Dataset, I went ahead and run a K=5 unsupervised ADMIXTURE Analysis for the Afrasan Dataset.

The K=5 ADMIXTURE run produced the following FST distances,
 
The biggest separation for both Axis is for the cluster I nicknamed Cushitic, while the Berber, Semitic and Mozabite clusters appear pretty close, with the Mozabites looking a bit isolated.

The Median proportions for the clusters can be seen below.
 
The fact that the mozbites formed their own cluster, is intriguing, although one would suspect that inbreeding may play a role, since it can also be seen how the Mozabites cluster away from other North Africans in the 3D MDS plot, almost forming their own group. 

Therefore, to see what this analysis would look like without the Mozabites, I took all 27 of them out, leaving me with 184 AA speaking samples.

I repeated the same analysis as above on the newer Dataset.

MDS Plots
Components 1 and 2 behaved the same way as when the Mozabites were included, Component 3 however, without the Mozabites, separates Berber and Cushitic speakers from the rest to almost the same degree, unlike when the Mozabites were included.

Model Based Analysis
This second iteration of the Afrasan dataset that did not include the Mozabites created a Cushitic, Chadic, Berber and Egyptian clusters, with a 5th cluster which looked like a relic that is present in trace amounts in all the Afrasan samples except the Mada and Hausa. The Egyptian cluster is also found in highland Ethiopians, it also shows a more frequent occurrence of high Standard Deviation relative to all the other clusters;
 
So the Egyptian cluster looks like it gives less of a linguistic signal than the other clusters, it could potentially be inclusive of a Semitic signal as well as maybe other types of non-Afroasiatic Eurasian affinities.

It would be of great interest to see where Omotic speakears would fit into this analysis.

Tuesday, February 28, 2012

Intra African Genome-Wide Analysis


The primary purpose of studying Haplogroups (NRY and mtDNA) is to describe population movements, AKA Phylogeography . Autosomal DNA on the other hand, gives a rather ambiguous indication of a certain populations Paternal and Maternal history, since the chromosomes used undergo genetic recombination and can not be traced back to a single common ancestor. But still, there are drawbacks in just using NRY or mtDNA to study the history of a given population, and that is that they constitute only of a single Loci, which thereby reduce the effective population size relative to the Autosomes.

To this end, I have utilised publicly available Genome-Wide SNP data to get further insight into the population structure of Africa which may not be fully understood only from the data of uni-parental markers that we have. Perhaps the best published work out there with respect to African Autosomal Genome-wide data is that from Tishkoff (2009), this important paper found 14 ancestral Clusters in the African continent using the most diverse African dataset to date, however, the paper used Autosomal Microsatellites and a handful of SNPs.

On a publicly available dataset, I carried out two of the most popular approaches to help investigate population structure in Africa using Autosomal genome-wide data; (1) The non-parametric approach known as Principal Components or Multi Dimensional Scaling, which uses a Matrix whose elements are the quantification of the genetic similarity between pairs of individuals, and on which such a Matrix is used in order to perform a Principal Component Analysis upon, and (2) An explicit model based population structure analysis using the software ADMIXTURE, where individuals are assumed to come from one of K discrete populations and where population membership and allele frequencies are estimated using a Bayesian modeling strategy.

DATASET
A super set of the Data I used can be downloaded from here :http://dl.dropbox.com/u/23271596/ref.zip
The global Data Set, compiled by this blog author, contains publicly available data from 3970 individuals from around the world typed for 27,022 Autosomal SNPs, which can be found all over the 22 pairs of chromosomes (but not uniformly). I then utilized PLINK to perform the following on the above Data Set:
  1. Removed all Non-Continental African populations.
  2. Removed 18 Tunisians from Henn (2011) as previous analysis had shown independent cluster formation by this group, perhaps a sign of inbreeding.
  3. Removed 15 Morrocan Jews that came from Behar (2010) for the same reason as above.
  4. Kept SNPs above 99.46% genotyping success rate.
  5. Excluded SNPs in linkage disequilibrium (r2>0.5) with nearby markers in a window of 50 SNPs (advanced by 5 SNP).
  6. Added a handful of private African samples that took their genetic test with the Personal Genomics Company, 23andME. (The results of which I can not unfortunately publish in this post)

The above procedures left me with a core (public) Dataset of 1,065 Individuals from Africa and 26,129 SNPs for analysis. The complete SNPs typed for these individuals can be retrieved from: Behar (2010), Hapmap III, Henn (2011), HGDP and Xing (2010)
Furthermore, geographically, 362 were from East Africa, 304 from West Africa, 158 from North Africa, 142 from Central Africa and 99 from South Africa. Linguistically, the dataset contained 536 Niger Kordofanian speakers, 212 Nilo-Saharans , 211 AfroAsiatic speakers, 89 Khoisans and 17 Hadza.

Update: Reference Populations and Key:
 

MDS Analysis
The data for the MDS analysis was generated using PLINK, while the plots were generated using GNU OCTAVE. A 3 dimensional MDS plot for the dataset can be seen below, all populations are labelled according to their Median Co-ordinates.
Here, we can see that the first component, C1, separates East and North Africans from West/Central/South Africans, while the Second Component separates the divergent hunter gatherers (San,!kung, pygmies and Hadza from the rest), this may be more clearer on the two dimensional C1 vs C2 plot below,
 
The third Component C3, separates East Africans from all the rest, as more clearly seen on a C1 vs C3 plot below,

 
Model Based Analysis
The model based analysis was carried out for K=10 using ADMIXTURE, thus 10 clusters were generated from the Dataset, I took the liberty to name these clusters, some on a geographic basis, others on a linguistic basis and still others on a subsistence basis, there is obviously a lot of fluidity associated in naming a cluster, so it shouldn't be taken as something written in stone.

A PCA plot for the FST distances generated by ADMIXTURE for the 10 clusters can be seen below,

 
The extreme positioning of the 'Hadza' cluster is indeed striking, followed by the 'KhoiSan' and 'Pygmy' clusters. The 'West African', 'West-Central African' and 'Eastern Bantu' clusters are quite close to each other as can be expected. The divergence of the North African cluster from East Africa can be explained by the significant extra African Admixture North Africans have as evidenced by the amount of their direct maternal ancestries coming from Europe and the Near East, while a majority of their paternal Ancestry comes from East Africa (Namely, E1b1b).

Below are the Median proportions for the 10 clusters generated by ADMIXTURE for the 45 uniquely entered African populations categorised according to their 5 respective regions.


The unclear abbreviations above for the samples of EtA, EtO and EtT are respectively Ethiopian Amharas, Ethiopian Oromos and Ethiopian Tigrayans, these samples (as well as the Ethiopian Jews, AKA Beta Israel) come from Behar (2010), in addition, the EtO samples purportedly come from the southern most tip of Ethiopia close to the Kenyan border. The dominance of the North African cluster in Ethiopians is not much of a surprise, as it is well known that Ethiopia is a genetic conduit between East and North Africa.

Here, both the mbuti and biaka pygmies form completely independent clusters, which is not unexpected as they are some of the most divergent populations even on a global basis. Also to note, is the slight 'North African' Affinity of the Hema and the 'West African' affinity of the Bulala and Mada.


Many of the non-Khoisan South African populations in the Dataset show affinities to both the 'Eastern Bantu' and 'Central-West African' clusters in almost equal proportions, which is interesting.

As seen in the PCA plots of the FST distances, the 'Central-West African', the 'West African', as well as the 'Eastern Bantu' clusters are close. The Dogon population however shows the least amount of the 'Central-West African' cluster and is almost completely dominated by the 'West African' cluster, which the reverse is true for the Igbo and Yoruba. Similarly, the Fulani show almost none of the 'Central-West African' cluster but rather, are mostly dominated by the 'West African' cluster, with the difference from the Dogon being that the Fulani have a significant affinity with the 'North African' cluster rather than the 'Central-West African' one.

 
In the last graphic above, we can see a geographic affinity of North West Africans with West African based clusters and North East Africans with East African dominant clusters, as to be expected. As stated before however, the 'North African' cluster itself is likely a both ancient and recent synthesis of East African, European and Near Eastern Affinities.

Conclusion
I learned quite a bit on the population structure of Africa from this exercise but there is a lot more room left for improvement:
  1. The SNPs that are typed using almost all genotyping arrays are Eurasian biased, as they were first found in Europeans, as time goes on, more African specific SNPs will be discovered and their use in genome-wide analysis will change these results.
  2. More samples are needed, especially from both South and North Sudan, all along the Sahel belt, Tuaregs, different Omotic speakers from Ethiopia, populations from Mozambique and the South Eastern coast of Africa, as well as the South Western coast (Angola) and many many more. The inclusion of these samples will have an impact on these results.
  3. More dense SNPs (~200k) may also give slightly different results, although Sikora (2010) notes the following: “We can conclude that the common set of 2841 SNPs genotyped is an appropriate tool to study population structure in African populations; in general, world-wide patterns are evident and robust when using a minimum of 1000 SNPs.”
  4. Newer and more computer intensive methods for bridging the gap between model based and distance based Autosomal analysis have recently been published, it would be interesting to carry out an analysis of this dataset with these newer methods.