YDNA
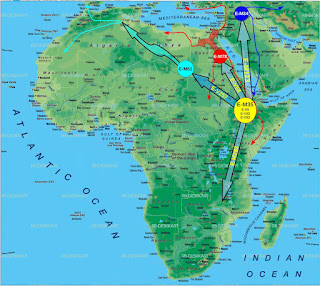
E1b1b migration route:Putative migration route of Haplogroup E1b1b since its genesis based upon current data. SNPs Z827 and Z830 are not shown in this map but their phylogeogrpahic implications are demonstrated. See this post for details. Author: Self.
Current understanding of E1b1b (M215) basic phylogeny:
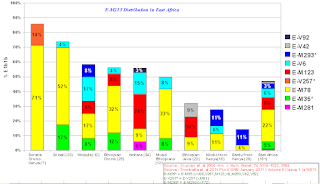
East African E1b1b Frequency:
Ethiopian Paternal Haplogroup Chart:
Author : Self, see this post for details.
Sudanese (+ other East African) YDNA:
Egyptian Western Desert YDNA (Source):
J1e (P-58) Frequency Distribution (Source):
Near Eastern YDNA distribution:
mtDNA
(I) Maternal haplogroup L3 distribution map for continental Africa:
(A) L3a, L3i, L3h, and L3x combined
(B) L3f
(C) L3e
(D) L3b
(E) L3d
(II) Putative Migration routes and origin of maternal Haplogroup L3
(III) Phylogeny of maternal Haplogroup L3
Author of Maps (I), (II) and (III) : Soares (2011), see this post for details.
Putative Migration routes and origin of root of all human maternal lineages:
Figure (b) description: An early Homo sapiens division in a hypothetical migration zone (1) resulted in two separately evolving populations (2) and the localization of L0 (green) in southern Africa and L105 (red) in eastern Africa. A subsequent dispersal event of the L0abf subset from the southern population and its mergence with the eastern population (brown) is suggested (3), resulting in the former population composed only of L0d and L0k and the latter composed of L105 and L0abf. Later dispersal waves from the eastern African population parallels the beginning of African LSA approximately 70,000 ybp (4). Rapid migrations during the LSA (5) brought descendants of the eastern African population into repeated contact with the southern population,peaking during the Bantu expansion (6).Author: Behar (2008)
Ethiopian mtDNA (Detailed):
Afar/Oromo mtDNA:
East African Regional mtDNA (Source)
 |
| Contour map of nucleotide diversity in the studied populations. |
 |
| Contour maps of the five most frequent macro-haplogroups in East Africa (L0, L2, L3, L4, M). |
Autosomal DNA
Microsattelite Autosomal Analysis of African Populations:
Author: Tishkoff (2009)
The Recent African Origin model of modern humans and population substructure in Africa.
Author: Campbell MC, Tishkoff SA.
Global (A) and African (B) PCA (Source):
Private Alleles by Region (Source):
Genetic Diversity - Heterozygousity (Source):
Genetic Diversity - Allele Size Variance (Source):
Global PCA, First two dimensions (Source):
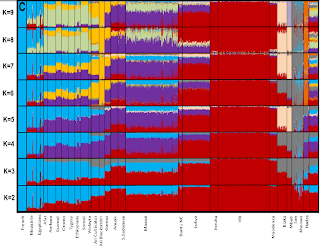
ADMIXTURE, Africa + French, K=2-9, (Source):
Pairwise FST and SNP Heterozygosity in a Set of Worldwide Populations, see label below figure for details (Source):
FST was calculated with the use of ten individuals from each worldwide population and Egyptians (A), Yoruba (B), and Semitic-Cushitic (C) and Nilotic-Omotic Ethiopians (D), and is displayed as a heat surface, produced with the Surfer software. Values in (C) and (D) are the averages for all the Semitic-Cushitic or Nilotic-Omotic populations. (E) shows the average genomic heterozygosity calculated for the same samples with the use of the available SNPs. The bottom-right section of each panel includes a scatter plot displaying the actual values of either Fst or heterozigosity over the geographic distance (in km) from Addis Ababa (negative for sub-Saharan populations). Filled and empty circles represent non-African populations along the putative northern or southern routes, respectively. Triangles represent sub-Saharan populations.
Language:
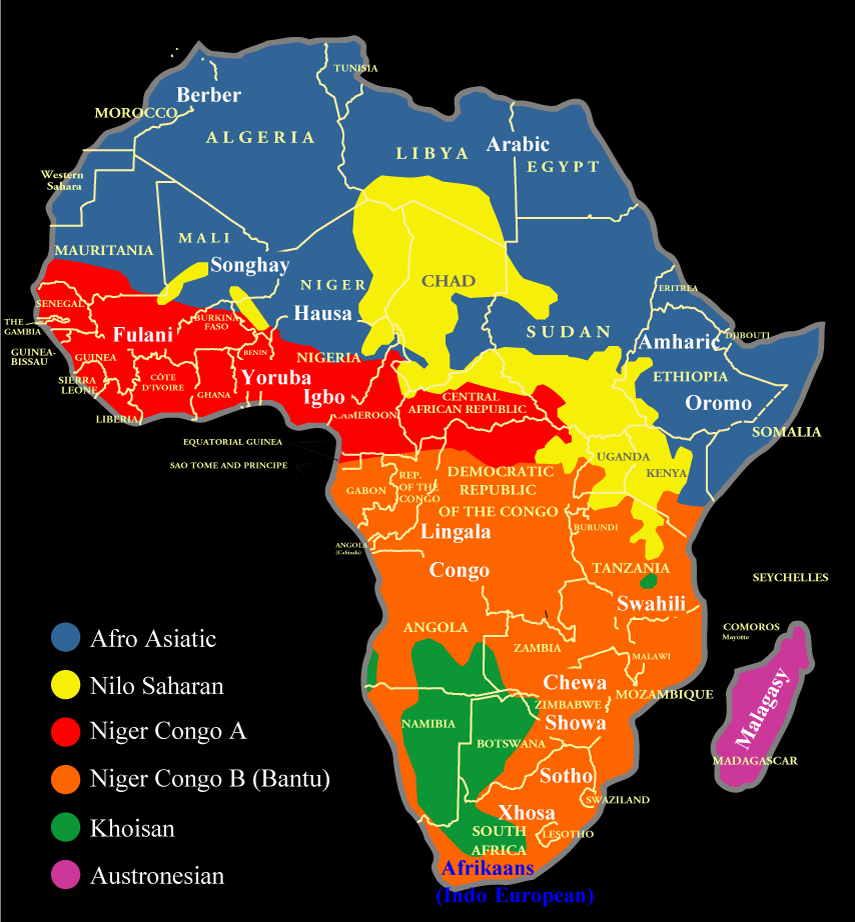
Generalized Language map of Africa:
Author: Nationsonline
Detailed Language Map of Ethiopia:
^ Note, Bilingualism not reflected
Author: muturzikinSee also Ethnologue's detailed descriptions here: Languages of Ethiopia
(A) Putative Semitic Dispersal:
(B) Putative Ethiosemitic topology:
Author (A), (B) : Kitchen (2009)
Putative Afroasiatic Dispersal:
Author : C.Ehret
Cushitic Stratigraphy:
Author: Tishkoff (2009) (supplemental)


No comments:
New comments are not allowed.