Showing posts with label East Africa. Show all posts

Thursday, July 30, 2015

Ugandan mtDNA

Unfortunately I can not find the detailed breakdown of the mtDNA frequencies for the populations sampled in the supplemental materials for this paper, and hence can not build my sortable frequency charts. 

Mosaic maternal ancestry in the Great Lakes region of East Africa

Abstract

The Great Lakes lie within a region of East Africa with very high human genetic diversity, home of many ethno-linguistic groups usually assumed to be the product of a small number of major dispersals. However, our knowledge of these dispersals relies primarily on the inferences of historical, linguistics and oral traditions, with attempts to match up the archaeological evidence where possible. This is an obvious area to which archaeogenetics can contribute, yet Uganda, at the heart of these developments, has not been studied for mitochondrial DNA (mtDNA) variation. Here, we compare mtDNA lineages at this putative genetic crossroads across 409 representatives of the major language groups: Bantu speakers and Eastern and Western Nilotic speakers. We show that Uganda harbours one of the highest mtDNA diversities within and between linguistic groups, with the various groups significantly differentiated from each other. Despite an inferred linguistic origin in South Sudan, the data from the two Nilotic-speaking groups point to a much more complex history, involving not only possible dispersals from Sudan and the Horn but also large-scale assimilation of autochthonous lineages within East Africa and even Uganda itself. The Eastern Nilotic group also carries signals characteristic of West-Central Africa, primarily due to Bantu influence, whereas a much stronger signal in the Western Nilotic group suggests direct West-Central African ancestry. Bantu speakers share lineages with both Nilotic groups, and also harbour East African lineages not found in Western Nilotic speakers, likely due to assimilating indigenous populations since arriving in the region ~3000 years ago.


Link

Tuesday, August 19, 2014

East African Climate on Hominin Evolution , Archaelogical evidence for African Homo Sapiens Substructure (pre-OOA)

East African climate pulses and early human evolution

Abstract

Current evidence suggests that all of the major events in hominin evolution have occurred in East Africa. Over the last two decades, there has been intensive work undertaken to understand African palaeoclimate and tectonics in order to put together a coherent picture of how the environment of East Africa has varied in the past. The landscape of East Africa has altered dramatically over the last 10 million years. It has changed from a relatively flat, homogenous region covered with mixed tropical forest, to a varied and heterogeneous environment, with mountains over 4 km high and vegetation ranging from desert to cloud forest. The progressive rifting of East Africa has also generated numerous lake basins, which are highly sensitive to changes in the local precipitation-evaporation regime. There is now evidence that the presence of precession-driven, ephemeral deep-water lakes in East Africa were concurrent with major events in hominin evolution. It seems the unusual geology and climate of East Africa created periods of highly variable local climate, which, it has been suggested could have driven hominin speciation, encephalisation and dispersal out of Africa. One example is the significant hominin speciation and brain expansion event at ∼1.8 Ma that seems to have been coeval with the occurrence of highly variable, extensive, deep-water lakes. This complex, climatically very variable setting inspired first the variability selection hypothesis, which was then the basis for the pulsed climate variability hypothesis. The newer of the two suggests that the long-term drying trend in East Africa was punctuated by episodes of short, alternating periods of extreme humidity and aridity. Both hypotheses, together with other key theories of climate-evolution linkages, are discussed in this paper. Though useful the actual evolution mechanisms, which led to early hominins are still unclear and continue to be debated. However, it is clear that an understanding of East African lakes and their palaeoclimate history is required to understand the context within which humans evolved and eventually left East Africa.

Link (Open Access)

Earliest evidence for the structure of Homo sapiens populations in Africa

Abstract

Understanding the structure and variation of Homo sapiens populations in Africa is critical for interpreting multiproxy evidence of their subsequent dispersals into Eurasia. However, there is no consensus on early H. sapiens demographic structure, or its effects on intra-African dispersals. Here, we show how a patchwork of ecological corridors and bottlenecks triggered a successive budding of populations across the Sahara. Using a temporally and spatially explicit palaeoenvironmental model, we found that the Sahara was not uniformly ameliorated between ∼130 and 75 thousand years ago (ka), as has been stated. Model integration with multivariate analyses of corresponding stone tools then revealed several spatially defined technological clusters which correlated with distinct palaeobiomes. Similarities between technological clusters were such that they decreased with distance except where connected by palaeohydrological networks. These results indicate that populations at the Eurasian gateway were strongly structured, which has implications for refining the demographic parameters of dispersals out of Africa.

Link (Closed Access)

Friday, February 21, 2014

YDNA E-M123; A closer look

E-M123 (as well as E-M34) was first discovered by Underhill(2000) and is found with a low to medium frequency distribution in East Africa and the Middle East, while it has a low frequency distribution in North Africa and Europe.

Phylogeny:
Figure 1 - Current and previous E-M215 phylogenetic structure 

Figure 1 shows a comparison of the basic phylogeny of E-M215/M35 as was known before 2011 (a) and after (b), with a 'who and when' key for the Discovery of the UEPs. Notice the impact the rearrangement has on the phylogenetic placement of E-M123, specifically the fact that E-M123 is shown to have a more recent common ancestor with the East and Southern African variants of E-M35, i.e. E-V42 and E-M293, before it does with any of the other variants of E-M35.

Previous publications:

While it is unfortunate that all of the research that has previously been published on E-M123 was done under the consideration of the older (and rather out of date) configuration of the basic structure of E-M35, it is still worth while to look at articles that have tried to untangle the origins and history of this lineage, of these, 3 come to mind:

Friday, February 14, 2014

Comprehensive Ethiopian YDNA TMRCA Estimates

Find below a comprehensive list for all central TMRCA estimates calculated from the Plaster thesis for 6 UEPs (look at this post under Interactive Chart of Figure 3.2 for the frequencies of the UEPs). P*(x R1a) & Y*(x BT,A3b2)  are not included due to their minimal frequency and very sporadic distribution. 

There were a total of 5,756 haplotypes reported with the paper for the markers DYS19, DYS388, DYS390, DYS391, DYS392 and DYS393.  30 of those haplotypes belonged to P*(x R1a) & Y*(x BT,A3b2), leaving a total of 5,726 haplotypes. These remaining haplotypes, were then categorized with the criteria of Cultural ID + Generic Language Group* + UEP, any group of haplotypes that conformed to this criteria with N >1 and with a coalescent not equal to 0 (meaning non-identical haplotypes) were processed for their TMRCA and reported, accounting for 5,668 or 98% of the total haplotypes reported for the paper.

The tables are ordered according to the frequencies of the tested UEPs in Ethiopia, i.e. E*(x E1b1a), 3985 Haplotypes  > J,  689 Haplotypes  > A3b2, 601 Haplotypes  > K*(xL,N1c,O2b,P) , 154 Haplotypes > BT*(xDE,JT), 193 Haplotypes  and E1b1a7, 46 Haplotypes .

Note that both the mean TMRCA's for Zhivotovsky (Z-TMRCA) and the pedigree rates (P-TMRCA), some times also known as germline rates, are in units of generations, the suitable length of a generation for the Z-TMRCA is 25 years, while for the P-TMRCA it may range from 28 to 33 years.

If detail of the TMRCA analysis for any of the populations listed below maybe required, go to the table here, and upload the necessary file into the Y TMRCA calculator and filter for the specific population in question.

Monday, December 9, 2013

More East African mtDNA Charts

Below are more East African mtDNA bar graphs from the Hirbo Thesis, the complementary YDNA charts can be seen in this post, along with the Boattini paper featured here, this gives us a more complete picture of East African mtDNA with a reasonable amount of detail.

Google Visualization API has been having problems for the past couple of months, so the tool tips as well as other functionalities of Google charts may not work, this post will be updated if they fix some of these issues.

With respect to some of the data points, the populations labeled with a * had their total number of samples adjusted in order for the percentages shown in Table 3.4.1 to make sense, that is, Orma has been adjusted from 20 to 21, Marakwet from 22 to 23, Pokot from 39 to 38, San from 11 to 12 and Bamoun from 18 to 20.


Wednesday, May 8, 2013

Another Extensive thesis on East African DNA


It was brought to my attention last week, thanks to a comment on this blog made by the user 'Umi', that another thesis on East African DNA variation was publicly available online:

Complex Genetic History of East African Human Populations

This is also an extensive thesis with a wealth of information akin to Plaster's thesis, the primary differences being that this one was more focused on parts of East Africa that are found further to the South of Ethiopia, and in addition to uni-parental analysis, it also included some Autosomal model-based inference, albeit of quite low resolution in today's standards; 848 microsattelites and 479 indels (refer to Tishkoff et al. 2009 for marker details).

Due to the extensive nature of the report I haven't had a chance to cover its entire scope, instead, for starters, I have first focused on the YDNA data by creating a relative frequency chart from the results reported in Fig. 3.3.2. 

Several things to initially point out here,

  • The report outlines the discovery of 4 new SNPs, TL1-4. The first two were found in Haplogroup B and downstream from B-M150 and B-M112 respectively. The last two, TL3 and TL4, were found in haplogroup E and downstream from E-U174 and E-V32 respectively. Incidentally, the fourth SNP that is under E-V32, TL4, could potentially be the same as Z808/Z809 as identified recently by the geneological community, however, as the report does not give the Y-Chromosome location of the SNP in a NCBI Build 36/37 format, this can not be verified, at least by me, at the moment.
  • A couple of the frequency results in Fig. 3.3.2 do not add up, in particular, the frequency results for the Boni and the Baggara, but also to a lesser extent for the Kanuri and Teita.  I have labeled the missing frequency results with a “?” in the relative charts for those specific populations.
  • The Burji and Konso are labeled as being only from Kenya throughout the report, however most Burji are from Ethiopia, and the Konso are exclusively found in Ethiopia, I have reflected this in the charts.
  • STR data is not readily available to perform TMRCA estimates on, however, some TMRCA results are reported using Zhivotovsky's rates in Table 3.3.1, nevertheless, these are estimates only for different lineages found in the dataset for all the samples and not necessarily comparing TMRCAs in the different populations under study.
  • J-M62, while a subclade of J-M267, is not the main subclade of J-M267 found in East Africa, that would be J-P58, therefore, the results for J-12f2.1 (x M62, M172) reported, may after all be, or largely include, J-P58 lineages, off-course those results could also include variants of J-M267 other than J-P58 and J-M62 as well since the SNP was not directly tested. 
  • E-P2* lineages are abundantly found (> 30%) in the Konso, Burji and Mbugwe, however on closer examination and correlation with current data, these could be E-M329, E-V38* or even E-M215*, as none of these SNPs were directly tested. Genuine E-P2* lineages would be positive for E-P2 and negative for V38 and M215 (See Trombetta et al. 2011)
  • Similarly, the E-M35* lineages reported could be members of relatively newly discovered lineages of E-Z830*( See this post for details), or some of the untested variantes of E-M35, i.e.  E-V42, V92 and maybe even E-V68 (x M78)

Friday, February 15, 2013

Gradient Maps for African ADMIXTURE components

Here below are gradient maps for my last African ADMIXTURE run, Africa_V2b, courtesy of a demo download of Mapviewer7 . The Kriging method was used for Gridding and 'Grid Z limits' mode was used for color mapping.

Sampled Population's Index

Sampled Population's Location

PCA for the FST distances
generated by ADMIXTURE  

West-Africa Cluster Freq.

Nilo-Saharan Cluster Freq.

East-Africa-2 Cluster Freq.

North-Africa Cluster Freq.

Khoi-San Cluster Freq.

Omotic Cluster Freq.

Mbuti-Pygmy Cluster Freq.

Biaka-Pygmy Cluster Freq.

Hadza Cluster Freq.

East-Africa-1 Cluster Freq.
Isometric view of the MDS plot
 for all Populations sampled


UPDATE (02/18/2013) : Below are gradient maps for the first African ADMIXTURE run, Africa_V1, courtesy of a demo download of Mapviewer7 . The same options as above were used both for gridding and color mapping.

Friday, February 8, 2013

Sudan YDNA

This is from a relatively old study, but it seems that it is the most comprehensive YDNA breakdown we have of North and South Sudan to date.

Y-chromosome variation among Sudanese: restricted gene flow, concordance with language, geography, and history. Hassan (2008)

Here is a map of the populations tested from Fig.1 of the Study
Populations Studied

Here below is the phylogeny (as known back in 2008) of the SNPs tested, note that those in bold; E-M75, E-P2, G-M201 and T-M70 were NOT tested in the study.

SNPs tested (except those in bold)
The E-M78+ cases from above were also tested for Cruciani's V-Series SNPs as well for further resolution,


Cruciani's V-Series SNPs (2007)

Some notes:


  • The high level (38%) of E-M215 (x M78) in the Borgu is quite intriguing, I wonder what variant/s of E-M215 it is?
  • Almost all the J-12f2(x M172) should be J-M267.
  • B-M60 is found in Southern Nilo-Saharan speakers and not the North Western ones, while A-M13 is found in both.
  • The F-M89(x M52,M170,I2f2, M9) found in the north is also interesting, although it could possibly be G-M201, at least part of it.
  • E-V22 has a relatively high presence in these samples, even when compared to the Egyptian samples from Cruciani '07, and most certainly higher than its presence in Ethiopia.
  • The High presence of E-V12 (x V32) is also concordant with its putative area of origin, all the E-M78 found in the Nuer and the Copts is of this variety.
  • The presence of E-M78* in the Masalit and the Nuba is notable.
  • Off course the strangest result is the 54% R-M173 (x P25) in the Fulani, this could be some R1b*(R-M343), or some type of R1a, the latter would be very out of place for the region, while the former could be reconciled with the presence of more downstream R1b variants in Africa. 


Monday, February 4, 2013

A speculative superimposition of E-M35 variants onto Afroasiatic.

Here is a speculative superimposition of the variants of YDNA E-M215/M35 (E1b1b/1) onto an Afroasiatic internal classification, Lionel Bender's (1997) classification. 


The red question marks represent a less unsure fit.

Monday, January 7, 2013

East African mtDNA variation has implications on the origin of Afroasiatic

The Dienekes' Anthropology Blog shows a new paper on East African mtDNA with implications for the origin of Afroasiatic, namely with the citing: "making the hypothesis of a Levantine origin of AA unlikely",  unfortunately I do not have access to the paper, I would greatly appreciate if anyone has access to it to please send me a copy here: ethiohelix@gmail.com.

Here is the abstract and the link:


Abstract

East Africa (EA) has witnessed pivotal steps in the history of human evolution. Due to its high environmental and cultural variability, and to the long-term human presence there, the genetic structure of modern EA populations is one of the most complicated puzzles in human diversity worldwide. Similarly, the widespread Afro-Asiatic (AA) linguistic phylum reaches its highest levels of internal differentiation in EA. To disentangle this complex ethno-linguistic pattern, we studied mtDNA variability in 1,671 individuals (452 of which were newly typed) from 30 EA populations and compared our data with those from 40 populations (2970 individuals) from Central and Northern Africa and the Levant, affiliated to the AA phylum. The genetic structure of the studied populations—explored using spatial Principal Component Analysis and Model-based clustering—turned out to be composed of four clusters, each with different geographic distribution and/or linguistic affiliation, and signaling different population events in the history of the region. One cluster is widespread in Ethiopia, where it is associated with different AA-speaking populations, and shows shared ancestry with Semitic-speaking groups from Yemen and Egypt and AA-Chadic-speaking groups from Central Africa. Two clusters included populations from Southern Ethiopia, Kenya and Tanzania. Despite high and recent gene-flow (Bantu, Nilo-Saharan pastoralists), one of them is associated with a more ancient AA-Cushitic stratum. Most North-African and Levantine populations (AA-Berber, AA-Semitic) were grouped in a fourth and more differentiated cluster. We therefore conclude that EA genetic variability, although heavily influenced by migration processes, conserves traces of more ancient strata. Am J Phys Anthropol, 2013. © 2013 Wiley Periodicals, Inc.

mtDNA variation in East Africa unravels the history of afro-asiatic groups

UPDATE: Ok, got it, this was a nice little article to read, however with respect to the implications of East African mtDNA variation on the origin of Afroasiatic, it did not offer nothing really substantially new, in terms of material evidence, that any reasonable person that has read up on this subject a little bit would not have known beforehand, namely:


Concerning the third point, i.e., the place of origin of AA (EA or the Levant), our results do not allow us to make conclusive statements. Indeed, coalescent simulations of different genetic parameters (Supporting Information Fig. 4) according to the two mentioned hypotheses show that—even assuming complete correlation between languages and mtDNA variability—their confidence intervals largely overlap. Thus, we limit ourselves to the following observations. First, EA shows the highest levels of nucleotide diversity among the studied populations with a decreasing cline towards NA and the Levant (Supporting Information Fig. 1 and Supporting Information Table 1). This is true not only for the Ethiopian cluster A, but also, and especially, for groups belonging to clusters B1 and B2. Second, EA hosts the two deepest clades of AA, Omotic and Cushitic. These families are found exclusively in EA, while the presence of Semitic in this area is much more recent. Third, cluster C – collecting Berber- and Semitic-speaking populations from NA and the Levant – shows only modest signals of admixture with clusters A and B (Fig. 2, Supporting Information Table 1). None of these points,
taken by itself, is conclusive, but undoubtedly the hypothesis of origin of AA in EA is the most parsimonious one, if compared to the Levant.

It did also have some very nicely made contour maps for EA, as well as detailed mtDNA haplogroup assignments for some 30 or so East African groups, which I will make an interactive chart for within the next couple of days.

UPDATE2 (01/08/2013): mtDNA haplogroups (46) in 31 groups.

A note on the sources for the samples listed above:


The Dinka Samples are from Krings etal. (1999)
The Sudan and Ethiopia Samples are from Soares et al. (2011)
The Tigrai, Amhara, Gurage, Oromo and Yemeni1 Samples are from Kivisild et al. (2004)
The Beta Israel Samples are from Beharet al. (2008)
The Ethiopian Jewish Samples are from Non et al. (2011)
The Somali Samples are from Soares et al. (2011) and Watson et al. (1997)
The Daasanach and Nyangatom Samples are from Poloni et al. (2009)
The Turkana2 Samples are from Poloni et al. (2009) and Watson et al. (1997)
The Nairobi Samples are from Brandstatter et al. (2004)
The Kikuyu Samples are from Watson et al. (1997)
The Hutu Samples are from Castrì etal. (2009)
The Iraqw Samples are from Knight etal. (2003)
The Burunge and Turu Samples are from Tishkoff et al. (2007)
The Datoga and Sukuma Samples are from Tishkoff et al. (2007) and Knight etal. (2003)

All the remaining samples: Dawro Konta, Ongota, Hamer, Rendille, Elmolo, Luo, Maasai, Samburu and Turkana are new and sampled along with this study.

Tuesday, December 11, 2012

National Geographic fesses up on the origin of E-M35

In their second phase of the massive global scale genetic testing project, Geno 2.0: The Greatest Journey Ever Told, National Geographic has finally fessed up to the most parsimonious explanation to the origin of YDNA haplogroup E1b1b1, this is good news, even if it took 8 years to do so, i.e. about 8 years after the publishing of the first detailed paper on E-M35.

In the first phase of the Geneographic project, launched in 2005, E-M35's origin was explictly stated as the following :

"The man who gave rise to marker M35 was born around 20,000 years ago in the Middle East. His descendants were among the first farmers and helped spread agriculture from the Middle East into the Mediterranean region."
Original E-M35 National Geographic Description


You can read what it reads today in the screen shot below:
Current E-M35 Nat. Geographic Description

There is also the sentence, "Today, in keeping with its place of origin, this line is common among Afro-Asiatic speakers", could the part, 'in keeping with its place of origin', be also a 'nudge' at the very distinct,  and in my opinion, strong, possibility that Afroasiatic may have originated in East Africa as well ?
If so, this would be a first for a major outlet like Nat Geo and others, even though, renowned Afroasiatic experts like Greenberg, Ehret, Blench et. al had said this for decades.

Update: Another point that is odd in their new phylogeny seen above, is the ordering of some of the NRY SNPs leading up-to V12, the SNPs leading up-to P147 are in standard sequence, i.e the sequence M42 > M168 > M203 > M96 > P147, is common knowledge, however P177 is listed as downstream of P2, where common knowledge says it is the reverse, i.e. P147 > P177 > P2, instead of P147 > P2 > P177. Similarliy, M215 is not known to be a subclade of M35.1 but rather the reverse, so overall, their sequence should read as follows : M42 > M168 > M203 > M96 > P147 > P177 > P2 > M215 > M35.1 > M78 > V12. Unless off-course they have found some samples that upset the standard NRY SNP sequence leading upto E-V12 that we do not know about yet.

Friday, June 22, 2012

Intra African Genome-Wide Analysis, V2

See Also : Intra African Genome-Wide Analysis, V1


Population References and First Pass K10 Analysis


K2 - K10 Analysis

Tuesday, June 19, 2012

Finding the TMRCA of Ethiopian YDNA lineages using an ASD method.


I have been lately working on computing TMRCAs using an ASD or average square difference method on publicly available Y-STR haplotypes. The premise for finding the TMRCA using the ASD method is quite straight forward and easy to understand, a putative ancestral haplotype is calculated for a given dataset and the repeat of each sample at each marker in the dataset is subtracted from this ancestral haplotype, this result is then cumulated and divided by the number of samples and the marker specific mutation rate, the process is repeated for every single marker in the dataset and the mean is then multiplied by an assumed years per generation length, the formula below articulates this method:
TMRCA formula (ASD method)
 
Where;
N= Total number of Samples
Z= Total number of Markers
L0= Putative Ancestral Haplotype (Median or Modal repeats)
L= Individual sample haplotype repeats
m= Marker Specific Mutation Rate
G= Years / Generation

The biggest variable here, other than the sampling strategy of a given dataset, are the several marker specific mutation rates that are available. The process of selection of a correct mutation rate is an unsettled issue, I have therefore utilized 4 sets of mutation rates that were compiled by Paul Newlin, a collaborator at the E3b Project, these rates come from several different publications and you can read about them here for more detail:
 
  1. The Chandler Mutation Rates:
  2. Stafford Bayesian Mutation Rates:
    Essentially a compilation of other mutation rates
  3. Burgarella & Navascués Mutation Rates:
  4. Ballantyne Mutation Rates:
In order to have an analogously accurate comparison of the TMRCAs between the different publications, I had to weed out and intersect the available markers from above with markers that are found in the public domain. This essentially left me with the following 46 markers that intersected with all 4 of the above sets of rates as well as the 66 markers that are widely used:
406s1 , 19 , 388 , 389-1 , 389-2 , 390 , 391 , 392 , 393 , 426 , 436 , 437 , 438 , 439 , 442 , 444 , 446 , 447 , 448 , 450 , 454 , 455 , 456 , 458 , 460 , 472 , 481 , 487 , 490 , 492 , 511 , 520 , 531 , 534 , 537 , 557 , 565 , 568 , 572 , 578 , 590 , 594 , 617 , 640 , 641 and gatah4.

In addition, since the Chandler mutation rates had a complete intersection with the 66 widely used markers, an additional 66 marker Chandler set was independently used that included the following markers in addition to the 46 listed above:
385a , 385b , 459a , 459b , 449 , 464a , 464b , 464c , 464d , ycaiia , ycaiib , 607 , 576 , 570 , cdya , cdyb , 395s1a , 395s1b , 413a and 413b.
  
Haplogroups A, E and J, cover well over 90% of the YDNA lineages found in Ethiopia. More specifically within these haplogroups, I was more interested in finding the TMRCA for A-M13, E-M35 and J1-M267, as these lineages cover over 70% but under 80% of said lineages, whereas the remaining 20-30% of lineages found in Ethiopia belong to E1b1*(x E1b1b,E1b1a1), other types of E lineages like E2 and E*, and some specific clades that belong to haplogroups B,T and J2.

Tuesday, March 6, 2012

Analyzing the North African cluster


Continuing with  the Intra-African genome-wide analysis, I wanted to further explore the 'North African' Cluster that appeared to be wide spread from East to North and West Africa, 408 individuals out of the 1065 total samples carried the North African cluster at a frequency greater than 5%. With some of these populations showing a relatively high Standard deviation (Normalized with N-1) for that particular cluster. 

The table below shows the Standard Deviation for each of the 10 clusters found in the Intra-African Genome-Wide Analysis.

Yellow; Moderate Standard Deviation, 5-10%
Green; High Standard Deviation, 10-20%
Red; Very High Standard Deviation, >20%


The North African cluster had a high standard deviation in the Sahara-OCC, Morrocans, SAN, Mozabite and Morroco-S populations. All of these populations however, excluding the SAN, carried the North African cluster, on Median, in very high proportions (> 69%), while the SAN had it on Median only at ~4%. 18 out of the 36 SAN samples did however carry the North African cluster anywhere between 5-56%. Therefore, I excluded these 18 samples from the 408 individuals who carried the North African cluster at greater than 5% and proceeded to create a Dataset with PLINK.

The North African Cluster Dataset thus included 390 individuals (plus a few private samples) typed at 26,129 SNPs (all other specifications held constant with the previous Dataset).
  
MDS Analysis
Here below are the MDS plots for the Dataset, the plots include a 3 Dimensional plot, C1 Vs. C2 plot and C1 vs. C3 Plot respectively.


The 1St component separates North Africans from the rest, with Ethiopians and Fulanis located at an intermediate position in this separation. The  2nd component separates West Africans from the rest, with Bantus (Kenya and South Africa) located at an intermediate position in this separation. The Last and 3rd component separates the Sandawe from everybody else.

Model Based Analysis.
5 clusters were generated from this dataset using ADMIXTURE, K=5, Unsupervised. A cluster that peaked in the Fulani, one cluster that peaked in the Mozabites, another cluster that peaked in the Sandawe, a fourth cluster that peaked in the Maasai, which I named East African, and a Last cluster that peaked in the Egyptians, which I named North East African, were observed. A PCA for the Fst distances that were generated by ADMIXTURE for these clusters can be seen below.
  
The largest vectorized Fst distance is seen for the Fulani, both for components 1&2, while the East African and Sandawe clusters appear to be close, similar to how the Mozabite and North East African clusters are close.

A standard deviation table (Normalized with N-1) for the 5 clusters generated can be seen below.


The Highest Average Standard Deviation across populations for the five clusters was among the Southern Morrocans and Mozabites (10.61 and 11.7% respectively).

Above are the Median proportions for all five clusters in the dataset.

The Mozabite cluster tapers off in a direction going east from the Northwest of Africa, where it is found at moderate frequencies in Egypt (~10%), the same can be said of the Fulani cluster, i.e tapering off in an eastward direction from Western Africa and found at a moderate (~6%) frequency in the Sandawe. The Sandawe cluster seems to be restricted to East Africa, although relatively high frequencies of it can also be seen in Southern Africa. The East African cluster, which peaks in the Maasai, is observed throughout East, West and Southern Africa. Finally, the North East African cluster merges North Africa with East Africa, for which a major portion can be accounted for with bi-directional Nile Corridor migrations, in addition to populations that used to live in the Sahara at a time when the desert was habitable. Minor, but gradiently significant Extra African input in the formation of the Mozabite and North East African clusters can also not be ruled out.

Tuesday, February 28, 2012

Intra African Genome-Wide Analysis


The primary purpose of studying Haplogroups (NRY and mtDNA) is to describe population movements, AKA Phylogeography . Autosomal DNA on the other hand, gives a rather ambiguous indication of a certain populations Paternal and Maternal history, since the chromosomes used undergo genetic recombination and can not be traced back to a single common ancestor. But still, there are drawbacks in just using NRY or mtDNA to study the history of a given population, and that is that they constitute only of a single Loci, which thereby reduce the effective population size relative to the Autosomes.

To this end, I have utilised publicly available Genome-Wide SNP data to get further insight into the population structure of Africa which may not be fully understood only from the data of uni-parental markers that we have. Perhaps the best published work out there with respect to African Autosomal Genome-wide data is that from Tishkoff (2009), this important paper found 14 ancestral Clusters in the African continent using the most diverse African dataset to date, however, the paper used Autosomal Microsatellites and a handful of SNPs.

On a publicly available dataset, I carried out two of the most popular approaches to help investigate population structure in Africa using Autosomal genome-wide data; (1) The non-parametric approach known as Principal Components or Multi Dimensional Scaling, which uses a Matrix whose elements are the quantification of the genetic similarity between pairs of individuals, and on which such a Matrix is used in order to perform a Principal Component Analysis upon, and (2) An explicit model based population structure analysis using the software ADMIXTURE, where individuals are assumed to come from one of K discrete populations and where population membership and allele frequencies are estimated using a Bayesian modeling strategy.

DATASET
A super set of the Data I used can be downloaded from here :http://dl.dropbox.com/u/23271596/ref.zip
The global Data Set, compiled by this blog author, contains publicly available data from 3970 individuals from around the world typed for 27,022 Autosomal SNPs, which can be found all over the 22 pairs of chromosomes (but not uniformly). I then utilized PLINK to perform the following on the above Data Set:
  1. Removed all Non-Continental African populations.
  2. Removed 18 Tunisians from Henn (2011) as previous analysis had shown independent cluster formation by this group, perhaps a sign of inbreeding.
  3. Removed 15 Morrocan Jews that came from Behar (2010) for the same reason as above.
  4. Kept SNPs above 99.46% genotyping success rate.
  5. Excluded SNPs in linkage disequilibrium (r2>0.5) with nearby markers in a window of 50 SNPs (advanced by 5 SNP).
  6. Added a handful of private African samples that took their genetic test with the Personal Genomics Company, 23andME. (The results of which I can not unfortunately publish in this post)

The above procedures left me with a core (public) Dataset of 1,065 Individuals from Africa and 26,129 SNPs for analysis. The complete SNPs typed for these individuals can be retrieved from: Behar (2010), Hapmap III, Henn (2011), HGDP and Xing (2010)
Furthermore, geographically, 362 were from East Africa, 304 from West Africa, 158 from North Africa, 142 from Central Africa and 99 from South Africa. Linguistically, the dataset contained 536 Niger Kordofanian speakers, 212 Nilo-Saharans , 211 AfroAsiatic speakers, 89 Khoisans and 17 Hadza.

Update: Reference Populations and Key:
 

MDS Analysis
The data for the MDS analysis was generated using PLINK, while the plots were generated using GNU OCTAVE. A 3 dimensional MDS plot for the dataset can be seen below, all populations are labelled according to their Median Co-ordinates.
Here, we can see that the first component, C1, separates East and North Africans from West/Central/South Africans, while the Second Component separates the divergent hunter gatherers (San,!kung, pygmies and Hadza from the rest), this may be more clearer on the two dimensional C1 vs C2 plot below,
 
The third Component C3, separates East Africans from all the rest, as more clearly seen on a C1 vs C3 plot below,

 
Model Based Analysis
The model based analysis was carried out for K=10 using ADMIXTURE, thus 10 clusters were generated from the Dataset, I took the liberty to name these clusters, some on a geographic basis, others on a linguistic basis and still others on a subsistence basis, there is obviously a lot of fluidity associated in naming a cluster, so it shouldn't be taken as something written in stone.

A PCA plot for the FST distances generated by ADMIXTURE for the 10 clusters can be seen below,

 
The extreme positioning of the 'Hadza' cluster is indeed striking, followed by the 'KhoiSan' and 'Pygmy' clusters. The 'West African', 'West-Central African' and 'Eastern Bantu' clusters are quite close to each other as can be expected. The divergence of the North African cluster from East Africa can be explained by the significant extra African Admixture North Africans have as evidenced by the amount of their direct maternal ancestries coming from Europe and the Near East, while a majority of their paternal Ancestry comes from East Africa (Namely, E1b1b).

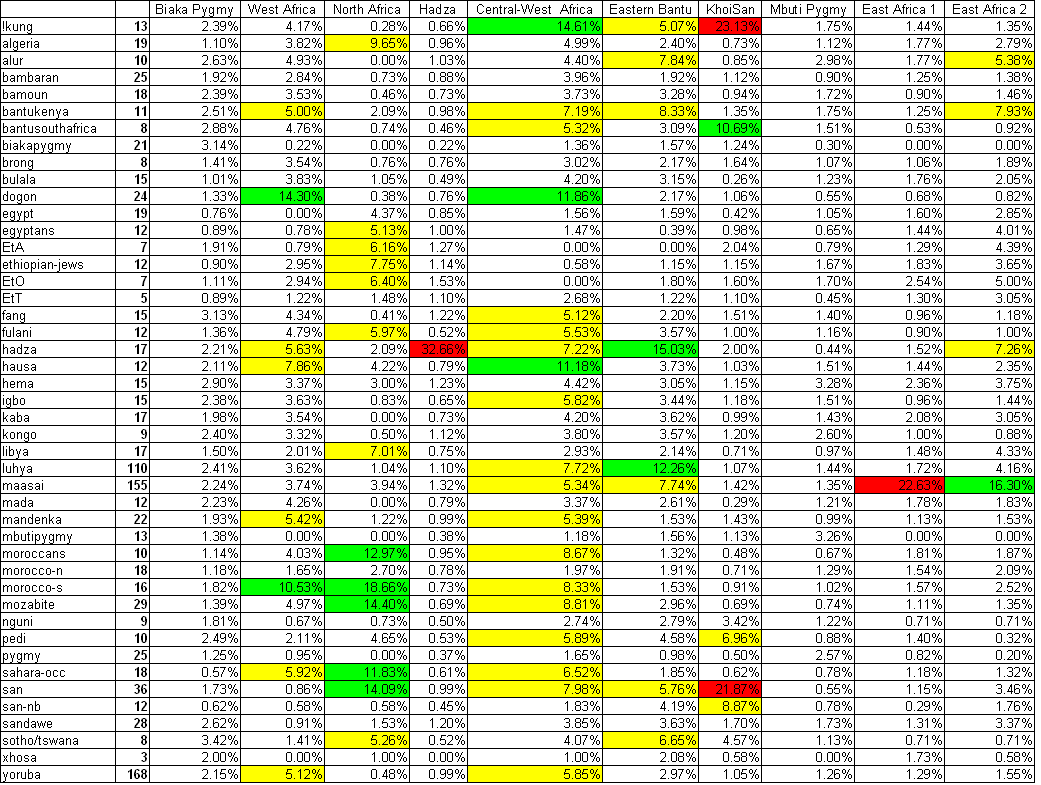
Below are the Median proportions for the 10 clusters generated by ADMIXTURE for the 45 uniquely entered African populations categorised according to their 5 respective regions.


The unclear abbreviations above for the samples of EtA, EtO and EtT are respectively Ethiopian Amharas, Ethiopian Oromos and Ethiopian Tigrayans, these samples (as well as the Ethiopian Jews, AKA Beta Israel) come from Behar (2010), in addition, the EtO samples purportedly come from the southern most tip of Ethiopia close to the Kenyan border. The dominance of the North African cluster in Ethiopians is not much of a surprise, as it is well known that Ethiopia is a genetic conduit between East and North Africa.

Here, both the mbuti and biaka pygmies form completely independent clusters, which is not unexpected as they are some of the most divergent populations even on a global basis. Also to note, is the slight 'North African' Affinity of the Hema and the 'West African' affinity of the Bulala and Mada.


Many of the non-Khoisan South African populations in the Dataset show affinities to both the 'Eastern Bantu' and 'Central-West African' clusters in almost equal proportions, which is interesting.

As seen in the PCA plots of the FST distances, the 'Central-West African', the 'West African', as well as the 'Eastern Bantu' clusters are close. The Dogon population however shows the least amount of the 'Central-West African' cluster and is almost completely dominated by the 'West African' cluster, which the reverse is true for the Igbo and Yoruba. Similarly, the Fulani show almost none of the 'Central-West African' cluster but rather, are mostly dominated by the 'West African' cluster, with the difference from the Dogon being that the Fulani have a significant affinity with the 'North African' cluster rather than the 'Central-West African' one.

 
In the last graphic above, we can see a geographic affinity of North West Africans with West African based clusters and North East Africans with East African dominant clusters, as to be expected. As stated before however, the 'North African' cluster itself is likely a both ancient and recent synthesis of East African, European and Near Eastern Affinities.

Conclusion
I learned quite a bit on the population structure of Africa from this exercise but there is a lot more room left for improvement:
  1. The SNPs that are typed using almost all genotyping arrays are Eurasian biased, as they were first found in Europeans, as time goes on, more African specific SNPs will be discovered and their use in genome-wide analysis will change these results.
  2. More samples are needed, especially from both South and North Sudan, all along the Sahel belt, Tuaregs, different Omotic speakers from Ethiopia, populations from Mozambique and the South Eastern coast of Africa, as well as the South Western coast (Angola) and many many more. The inclusion of these samples will have an impact on these results.
  3. More dense SNPs (~200k) may also give slightly different results, although Sikora (2010) notes the following: “We can conclude that the common set of 2841 SNPs genotyped is an appropriate tool to study population structure in African populations; in general, world-wide patterns are evident and robust when using a minimum of 1000 SNPs.”
  4. Newer and more computer intensive methods for bridging the gap between model based and distance based Autosomal analysis have recently been published, it would be interesting to carry out an analysis of this dataset with these newer methods.