Showing posts with label ADMIXTURE. Show all posts

Thursday, March 28, 2013

Global Contour Map for the Dual ADMIXTURE Components.

Below is a contour map representing the African ADMIXTURE component at K=2 for the Global data set (V2) which  can be downloaded here, and population specific percentages that can be seen here

Contour map generated using Mapviewer7, Kriging method was used for gridding. ADMIXTURE outputs for all New World, Jewish, Singapore-Chinese and Singapore-Indian populations were removed before the generation of the map.

African cline from ADMIXTURE, K=2 . Black dots represent locations of sampled populations


 Some things to note,

  • Since this is a K2 run, the OOA or the 'other' component has a complete mirror distribution relative to the distribution of the African component seen in the above.
  • The regions where the brown color dominates (20-35% African ) are the same regions that are later on absorbed by the new component that arises @ K=3, which finds its peaks in West Eurasians and has an FST that is intermediate between those of the African and East Asian/Amerindian components.
  • It is notable to observe the congruence of the above with the distribution of global genetic as well as phenotypic diversity (below)1


Global phenotypic and genetic Diversity 
1.The effect of ancient population bottlenecks on human phenotypic variation

Friday, February 15, 2013

Gradient Maps for African ADMIXTURE components

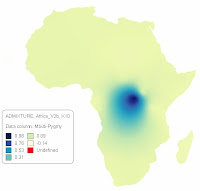
Here below are gradient maps for my last African ADMIXTURE run, Africa_V2b, courtesy of a demo download of Mapviewer7 . The Kriging method was used for Gridding and 'Grid Z limits' mode was used for color mapping.

Sampled Population's Index

Sampled Population's Location

PCA for the FST distances
generated by ADMIXTURE  

West-Africa Cluster Freq.

Nilo-Saharan Cluster Freq.

East-Africa-2 Cluster Freq.

North-Africa Cluster Freq.

Khoi-San Cluster Freq.

Omotic Cluster Freq.

Mbuti-Pygmy Cluster Freq.

Biaka-Pygmy Cluster Freq.

Hadza Cluster Freq.

East-Africa-1 Cluster Freq.
Isometric view of the MDS plot
 for all Populations sampled


UPDATE (02/18/2013) : Below are gradient maps for the first African ADMIXTURE run, Africa_V1, courtesy of a demo download of Mapviewer7 . The same options as above were used both for gridding and color mapping.

Saturday, July 7, 2012

The World At K=2


The most basic Autosomal genetic division of the world is between Africans and Out of Africans (OOA), this is not only seen on global PCA or MDS maps , where the first PC separates Africans from non Africans, but can also be observed with model based statistical (Bayesian) Analysis as well, where the first model iteration, i.e. K=2 distinguishes Africans from non-Africans.
Here, I present (for reference) the full ADMIXTURE, K=2 results for a global dataset of 2,967 individuals from around the world, sampled for 16,595 SNPs with a total genotyping rate of 99.6%.

The results are arranged from the highest median African % to the lowest.

Friday, June 22, 2012

Intra African Genome-Wide Analysis, V2

See Also : Intra African Genome-Wide Analysis, V1


Population References and First Pass K10 Analysis


K2 - K10 Analysis

Saturday, March 31, 2012

Cross Validating and K Selection


There are two ways of choosing a K value for any given dataset that one wishes to perform an ADMIXTURE run on, one is to throw a dart at a random set of numbers and hope it works out for the very best, the other is to run ADMIXTURE at different K's while computing a cross validation error for each of the K values using the --cv flag, I did this with the studentized global dataset that I discussed earlier in this post. The Cross Validation error values for K 1-14 for that particular dataset can be seen in the graphs below,

close up :
While the CV-Error values do not start flattening out until about K=10, the CV error values do not start inflecting until K=13, meaning K=13 is the appropriate choice for this dataset.

Cross Validation can take a considerably long time to run, as each consecutive K has to be evaluated along with its error separately, unless one has access to a very fast machine off-course.

As a reference, the Bash shell code to run Cross Validation in ADMIXTURE for up-to K=14 is:

for K in 1 2 3 4 5 6 7 8 9 10 11 12 13 14; \
do ./admixture32 -j2 --cv=14 “filename.bed” $K | tee log${K}.out; done

where CV error values will be recorded in the .out files for each K.

Peaking populations for each cluster for K =2-13

K=2
Cluster1: pygmy,mbutipygmy,sotho/tswana,biakapygmy,fang

Cluster2: chinese-americans,tujia,miao,hezhen,han

East Asians and Africans split, with West Asians and Europeans belonging to 1/3 African and 2/3 East Asian, the reverse is seen with Ethiopians, 2/3 African and 1/3 East Asian.


Wednesday, March 21, 2012

A Supervised Global ADMIXTURE Run


A supervised ADMIXTURE run, assumes that certain populations within a given dataset are 100% of a certain ancestry, so for instance, given one wants to run ADMIXTURE at K=10 in supervised mode, then 10 different populations that are assumed to come from the 10 putative ancestral clusters that the software will infer, or rather will be forced to infer, must be manually selected.

I wanted to explore this type of a run on a global basis and purposefully select populations that not only may form their own clusters in an unsupervised run, but are also thought to be within the 'trunk', bifurcation 'nodes' and end 'branches' of the ancestral 'tree' of all people.
  
The basis of this run is the global dataset than can be downloaded in PLINK format from here. The dataset, a superset of the African dataset that I have been thus far utilizing, contains 3,970 individuals from around the world typed at 27,022 genome-wide SNPs.
A 3 dimensional, as well as a dim1 vs dim2, MDS plot labelled according to the median coordinates of the population groups for this dataset can be seen below:


The general structure of a globally spread PCA/MDS plot is well known and understood, the first principal component, describing the highest variation of all the components, separates Africans from non-Africans, while the second principal component separates West Asians/Europeans from East Asians, Oceanians and Native Americans. The 3rd principal component can be however shaky, in the plot above it separates Native Americans from the rest, however other sources have shown that the 3rd principal component in a global PCA separates divergent hunter gatherers (like the Hadza, Sandawe, San and Pygmies) from every body else, perhaps a 3-D PCA generated from full genome scans will put this to rest once and for all.