Showing posts with label E-M35. Show all posts

Friday, February 21, 2014

YDNA E-M123; A closer look

E-M123 (as well as E-M34) was first discovered by Underhill(2000) and is found with a low to medium frequency distribution in East Africa and the Middle East, while it has a low frequency distribution in North Africa and Europe.

Phylogeny:
Figure 1 - Current and previous E-M215 phylogenetic structure 

Figure 1 shows a comparison of the basic phylogeny of E-M215/M35 as was known before 2011 (a) and after (b), with a 'who and when' key for the Discovery of the UEPs. Notice the impact the rearrangement has on the phylogenetic placement of E-M123, specifically the fact that E-M123 is shown to have a more recent common ancestor with the East and Southern African variants of E-M35, i.e. E-V42 and E-M293, before it does with any of the other variants of E-M35.

Previous publications:

While it is unfortunate that all of the research that has previously been published on E-M123 was done under the consideration of the older (and rather out of date) configuration of the basic structure of E-M35, it is still worth while to look at articles that have tried to untangle the origins and history of this lineage, of these, 3 come to mind:

Wednesday, May 8, 2013

Another Extensive thesis on East African DNA


It was brought to my attention last week, thanks to a comment on this blog made by the user 'Umi', that another thesis on East African DNA variation was publicly available online:

Complex Genetic History of East African Human Populations

This is also an extensive thesis with a wealth of information akin to Plaster's thesis, the primary differences being that this one was more focused on parts of East Africa that are found further to the South of Ethiopia, and in addition to uni-parental analysis, it also included some Autosomal model-based inference, albeit of quite low resolution in today's standards; 848 microsattelites and 479 indels (refer to Tishkoff et al. 2009 for marker details).

Due to the extensive nature of the report I haven't had a chance to cover its entire scope, instead, for starters, I have first focused on the YDNA data by creating a relative frequency chart from the results reported in Fig. 3.3.2. 

Several things to initially point out here,

  • The report outlines the discovery of 4 new SNPs, TL1-4. The first two were found in Haplogroup B and downstream from B-M150 and B-M112 respectively. The last two, TL3 and TL4, were found in haplogroup E and downstream from E-U174 and E-V32 respectively. Incidentally, the fourth SNP that is under E-V32, TL4, could potentially be the same as Z808/Z809 as identified recently by the geneological community, however, as the report does not give the Y-Chromosome location of the SNP in a NCBI Build 36/37 format, this can not be verified, at least by me, at the moment.
  • A couple of the frequency results in Fig. 3.3.2 do not add up, in particular, the frequency results for the Boni and the Baggara, but also to a lesser extent for the Kanuri and Teita.  I have labeled the missing frequency results with a “?” in the relative charts for those specific populations.
  • The Burji and Konso are labeled as being only from Kenya throughout the report, however most Burji are from Ethiopia, and the Konso are exclusively found in Ethiopia, I have reflected this in the charts.
  • STR data is not readily available to perform TMRCA estimates on, however, some TMRCA results are reported using Zhivotovsky's rates in Table 3.3.1, nevertheless, these are estimates only for different lineages found in the dataset for all the samples and not necessarily comparing TMRCAs in the different populations under study.
  • J-M62, while a subclade of J-M267, is not the main subclade of J-M267 found in East Africa, that would be J-P58, therefore, the results for J-12f2.1 (x M62, M172) reported, may after all be, or largely include, J-P58 lineages, off-course those results could also include variants of J-M267 other than J-P58 and J-M62 as well since the SNP was not directly tested. 
  • E-P2* lineages are abundantly found (> 30%) in the Konso, Burji and Mbugwe, however on closer examination and correlation with current data, these could be E-M329, E-V38* or even E-M215*, as none of these SNPs were directly tested. Genuine E-P2* lineages would be positive for E-P2 and negative for V38 and M215 (See Trombetta et al. 2011)
  • Similarly, the E-M35* lineages reported could be members of relatively newly discovered lineages of E-Z830*( See this post for details), or some of the untested variantes of E-M35, i.e.  E-V42, V92 and maybe even E-V68 (x M78)

Thursday, March 7, 2013

African Sahel YDNA


Multiple and differentiated contributions to the male gene pool of pastoral and farmer populations of the African Sahel


ABSTRACT

The African Sahel is conducive to studies of divergence/admixture genetic events as a result of its population history being so closely related with past climatic changes. Today, it is a place of the co-existence of two differing food-producing subsistence systems, i.e., that of sedentary farmers and nomadic pastoralists, whose populations have likely been formed from several dispersed indigenous hunter-gatherer groups. Using new methodology, we show here that the male gene pool of the extant populations of the African Sahel harbors signatures of multiple and differentiated contributions from different genetic sources. We also show that even if the Fulani pastoralists and their neighboring farmers share high frequencies of four Y chromosome subhaplogroups of E, they have drawn on molecularly differentiated subgroups at different times. These findings, based on combinations of SNP and STR polymorphisms, add to our previous knowledge and highlight the role of differences in the demographic history and displacements of the Sahelian populations as a major factor in the segregation of the Y chromosome lineages in Africa. Interestingly, within the Fulani pastoralist population as a whole, a differentiation of the groups from Niger is characterized by their high presence of R1b-M343 and E1b1b1-M35. Moreover, the R1b-M343 is represented in our dataset exclusively in the Fulani group and our analyses infer a north-to-south African migration route during a recent past.

Closed Access


Y(x CF)  Phylogeny, Red = SNPs Tested, Blue =Presumed Tested 
CF Phylogeny, Red = SNPs Tested, Blue =Presumed Tested

Thursday, February 21, 2013

The Zhivotovsky Multiplier


It is reported that Zhivotovsky's effective mutation rate [1] has the effect of increasing the TMRCA of a lineage, as computed by the use of Microsattelite Genetic Distances[2], by a factor of 3-4 fold relative to TMRCAs computed via mutation rates observed in pedigree and family studies [3].

By utilizing my TMRCA calculating program, I want to explore,
  1. What effect does different marker combinations have on this multiplier ?
  2. What effect does marker size have on this multiplier ?
  3. Is there a variation in this multiplier for different data-sets?

First, to ensure that my program correctly calculates the TMRCA when the Zhivotovsky mutation rate of 0.00069 is applied to all the markers in my database consistently (versus only the marker specific Pedigree mutation rates I have thus far been utilizing), I attempted to replicate the TMRCA computations of the following publication;


Friday, February 8, 2013

Sudan YDNA

This is from a relatively old study, but it seems that it is the most comprehensive YDNA breakdown we have of North and South Sudan to date.

Y-chromosome variation among Sudanese: restricted gene flow, concordance with language, geography, and history. Hassan (2008)

Here is a map of the populations tested from Fig.1 of the Study
Populations Studied

Here below is the phylogeny (as known back in 2008) of the SNPs tested, note that those in bold; E-M75, E-P2, G-M201 and T-M70 were NOT tested in the study.

SNPs tested (except those in bold)
The E-M78+ cases from above were also tested for Cruciani's V-Series SNPs as well for further resolution,


Cruciani's V-Series SNPs (2007)

Some notes:


  • The high level (38%) of E-M215 (x M78) in the Borgu is quite intriguing, I wonder what variant/s of E-M215 it is?
  • Almost all the J-12f2(x M172) should be J-M267.
  • B-M60 is found in Southern Nilo-Saharan speakers and not the North Western ones, while A-M13 is found in both.
  • The F-M89(x M52,M170,I2f2, M9) found in the north is also interesting, although it could possibly be G-M201, at least part of it.
  • E-V22 has a relatively high presence in these samples, even when compared to the Egyptian samples from Cruciani '07, and most certainly higher than its presence in Ethiopia.
  • The High presence of E-V12 (x V32) is also concordant with its putative area of origin, all the E-M78 found in the Nuer and the Copts is of this variety.
  • The presence of E-M78* in the Masalit and the Nuba is notable.
  • Off course the strangest result is the 54% R-M173 (x P25) in the Fulani, this could be some R1b*(R-M343), or some type of R1a, the latter would be very out of place for the region, while the former could be reconciled with the presence of more downstream R1b variants in Africa. 


Monday, February 4, 2013

A speculative superimposition of E-M35 variants onto Afroasiatic.

Here is a speculative superimposition of the variants of YDNA E-M215/M35 (E1b1b/1) onto an Afroasiatic internal classification, Lionel Bender's (1997) classification. 


The red question marks represent a less unsure fit.

Saturday, January 5, 2013

TMRCA calculations from Plaster NRY data : Correcting an Error


Previously, I had computed TMRCAs for the YDNA STR data from the additional material that was provided along with Dr.Chris Plaster's thesis. However, after a brief communication with the author, I found out that the marker order of the STRs in the excel file was reported wrongly, the correct order for the markers are thus as follows:

DYS19 DYS388 DYS389I DYS389II DYS390 DYS391 DYS392 DYS393 DYS437 DYS438 DYS439 DYS448 DYS456 DYS635 Y GATA H4

This changes my TMRCA calculations because I am not computing the coalescent using a generic mutation rate that is equivalent for all the markers, but rather each marker has its own mutation rate attributed to it.

When I rerun my program using the newly corrected order above I get the following:


As can be seen, using the new order of markers generally reduces the number of generations to coalescent for the Plaster data-set. The previous observation of a relatively lower TMRCA for the haplozone data of E-M123 versus that of the E-M34 Plaster data-set largely disappears. 

To check if the fact that the high number of samples (129) present in the E-M123 haplozone data-set was skewing the results, I took 23 random samples (which equals the same number of samples available in the Plaster E-M34 data-set) from the larger E-M123 Haplozone dataset and re-run the TMRCA calculations on just those samples, I repeated this process 300 times, only 28% of the runs yielded a mean TMRCA less than the E-M34 Plaster data-set, if sample size was skewing the results I would expect >50% of the runs to have a mean TMRCA less than that of the E-M34 plaster dataset.

That said, the E-M34 Plaster data-set still had a relatively higher generations to coalescent than the E-M84 Haplozone dataset, E-M84 is a subclade of E-M34 and a high majority of haplotypes that belong to E-M34 also test positive for the E-M84 SNP (at least for the non-African E-M34 haplotypes that we know of).

Other than that, the new, and corrected, ordering of the markers did not have much impact in relative TMRCA terms between the Plaster and Haplozone/FTDNA data for the other lineages I had tested.

Tuesday, December 11, 2012

National Geographic fesses up on the origin of E-M35

In their second phase of the massive global scale genetic testing project, Geno 2.0: The Greatest Journey Ever Told, National Geographic has finally fessed up to the most parsimonious explanation to the origin of YDNA haplogroup E1b1b1, this is good news, even if it took 8 years to do so, i.e. about 8 years after the publishing of the first detailed paper on E-M35.

In the first phase of the Geneographic project, launched in 2005, E-M35's origin was explictly stated as the following :

"The man who gave rise to marker M35 was born around 20,000 years ago in the Middle East. His descendants were among the first farmers and helped spread agriculture from the Middle East into the Mediterranean region."
Original E-M35 National Geographic Description


You can read what it reads today in the screen shot below:
Current E-M35 Nat. Geographic Description

There is also the sentence, "Today, in keeping with its place of origin, this line is common among Afro-Asiatic speakers", could the part, 'in keeping with its place of origin', be also a 'nudge' at the very distinct,  and in my opinion, strong, possibility that Afroasiatic may have originated in East Africa as well ?
If so, this would be a first for a major outlet like Nat Geo and others, even though, renowned Afroasiatic experts like Greenberg, Ehret, Blench et. al had said this for decades.

Update: Another point that is odd in their new phylogeny seen above, is the ordering of some of the NRY SNPs leading up-to V12, the SNPs leading up-to P147 are in standard sequence, i.e the sequence M42 > M168 > M203 > M96 > P147, is common knowledge, however P177 is listed as downstream of P2, where common knowledge says it is the reverse, i.e. P147 > P177 > P2, instead of P147 > P2 > P177. Similarliy, M215 is not known to be a subclade of M35.1 but rather the reverse, so overall, their sequence should read as follows : M42 > M168 > M203 > M96 > P147 > P177 > P2 > M215 > M35.1 > M78 > V12. Unless off-course they have found some samples that upset the standard NRY SNP sequence leading upto E-V12 that we do not know about yet.

Monday, November 26, 2012

Extensive Doctoral Thesis on Ethiopian Y and mtDNA

I was contacted earlier by Dr. Chris Plaster about a doctoral thesis on Ethiopian Y & mtDNA that was completed 2 years ago but had been embargoed to the public until only about two months ago. As this is the first time I am coming across of it, plus since it is 204 pages long I have not had a chance to go through it thoroughly, but suffice it to say that this is the most extensive work on Ethiopian NRY & mtDNA that I have seen to date, although the resolution leaves a lot to be desired, I will update this post more as I read it more thoroughly over the next few days/weeks...


Variation in Y chromosome, mitochondrial DNA and labels of identity on Ethiopia


Some numbers and figures that caught my attention at first glance:


The Discussion section also has some interesting things to say, especially with respects to haplogroups A3b2 and J, but also the remaining ones found in Ethiopia as well.

Tuesday, June 19, 2012

Finding the TMRCA of Ethiopian YDNA lineages using an ASD method.


I have been lately working on computing TMRCAs using an ASD or average square difference method on publicly available Y-STR haplotypes. The premise for finding the TMRCA using the ASD method is quite straight forward and easy to understand, a putative ancestral haplotype is calculated for a given dataset and the repeat of each sample at each marker in the dataset is subtracted from this ancestral haplotype, this result is then cumulated and divided by the number of samples and the marker specific mutation rate, the process is repeated for every single marker in the dataset and the mean is then multiplied by an assumed years per generation length, the formula below articulates this method:
TMRCA formula (ASD method)
 
Where;
N= Total number of Samples
Z= Total number of Markers
L0= Putative Ancestral Haplotype (Median or Modal repeats)
L= Individual sample haplotype repeats
m= Marker Specific Mutation Rate
G= Years / Generation

The biggest variable here, other than the sampling strategy of a given dataset, are the several marker specific mutation rates that are available. The process of selection of a correct mutation rate is an unsettled issue, I have therefore utilized 4 sets of mutation rates that were compiled by Paul Newlin, a collaborator at the E3b Project, these rates come from several different publications and you can read about them here for more detail:
 
  1. The Chandler Mutation Rates:
  2. Stafford Bayesian Mutation Rates:
    Essentially a compilation of other mutation rates
  3. Burgarella & Navascués Mutation Rates:
  4. Ballantyne Mutation Rates:
In order to have an analogously accurate comparison of the TMRCAs between the different publications, I had to weed out and intersect the available markers from above with markers that are found in the public domain. This essentially left me with the following 46 markers that intersected with all 4 of the above sets of rates as well as the 66 markers that are widely used:
406s1 , 19 , 388 , 389-1 , 389-2 , 390 , 391 , 392 , 393 , 426 , 436 , 437 , 438 , 439 , 442 , 444 , 446 , 447 , 448 , 450 , 454 , 455 , 456 , 458 , 460 , 472 , 481 , 487 , 490 , 492 , 511 , 520 , 531 , 534 , 537 , 557 , 565 , 568 , 572 , 578 , 590 , 594 , 617 , 640 , 641 and gatah4.

In addition, since the Chandler mutation rates had a complete intersection with the 66 widely used markers, an additional 66 marker Chandler set was independently used that included the following markers in addition to the 46 listed above:
385a , 385b , 459a , 459b , 449 , 464a , 464b , 464c , 464d , ycaiia , ycaiib , 607 , 576 , 570 , cdya , cdyb , 395s1a , 395s1b , 413a and 413b.
  
Haplogroups A, E and J, cover well over 90% of the YDNA lineages found in Ethiopia. More specifically within these haplogroups, I was more interested in finding the TMRCA for A-M13, E-M35 and J1-M267, as these lineages cover over 70% but under 80% of said lineages, whereas the remaining 20-30% of lineages found in Ethiopia belong to E1b1*(x E1b1b,E1b1a1), other types of E lineages like E2 and E*, and some specific clades that belong to haplogroups B,T and J2.

Wednesday, January 4, 2012

E1b1b Update

The past year has seen more updates to the general phylogenetic structure of E1b1b (E-M215/M35) than in the previous 6 to 7 years.
I will attempt to highlight the main changes.
First, in the begining of last year Trombetta et. al came out with the paper:
A New Topology of the Human Y Chromosome Haplogroup E1b1 (E-P2) Revealed through the Use of Newly Characterized Binary Polymorphisms

This paper not only found new SNPs and structure below E1b1b1 (E-M35), but also revamped the overall E1b1 (E-P2) structure as seen below :


More over, the paper further confirmed what was previously thought about the origin of E1b1 (E-P2) in East Africa by stating:

"The new topology here reported has important implications as to the origins of the haplogroup E1b1. Using the principle of the phylogeographic parsimony, the resolution of the E1b1b trifurcation in favor of a common ancestor of E-M2 and E-M329 strongly supports the hypothesis that haplogroup E1b1 originated in eastern Africa, as previously suggested, and that chromosomes E-M2, so frequently observed in sub-Saharan Africa, trace their descent to a common ancestor present in eastern Africa."

The paper then went further to test the New SNPs on the old Cruciani '04 dataset , see below for the East African results once the New SNPs were incorporated:


Note that E-V42 and E-V92 were not found outside of Ethiopia, and that newly restructured 'sibling' of E-M35 , i.e. E-M281, found in the 34 Ethiopian Amhara sample (previously recognized as E-M215*).
Accordingly, SNPs from Haplogroup E tested in Ethiopia to date by the various papers published has been updated below. Note that Trombetta '11 is not itemized separately since the dataset is the same as that from Cruciani '04.
The next update for the E-M35 phylogeny came at the end of last year, however this time not in a form of a published paper but by the work of individuals in the genealogical community, by data mining Y-chromosomes from the 1000 genome project a couple of SNPs that changed the internal structure of E-M35 were found. The first SNP, labeled as Z827, united E-M123, E-V257, E-V42 and E-M293. The second SNP, labeled as Z830 found to be downstream of E-Z827, united E-M123, E-M293 and E-V42.  The newly proposed structure is shown below, it is important to note that more samples need to be tested to verify this new structure.

 
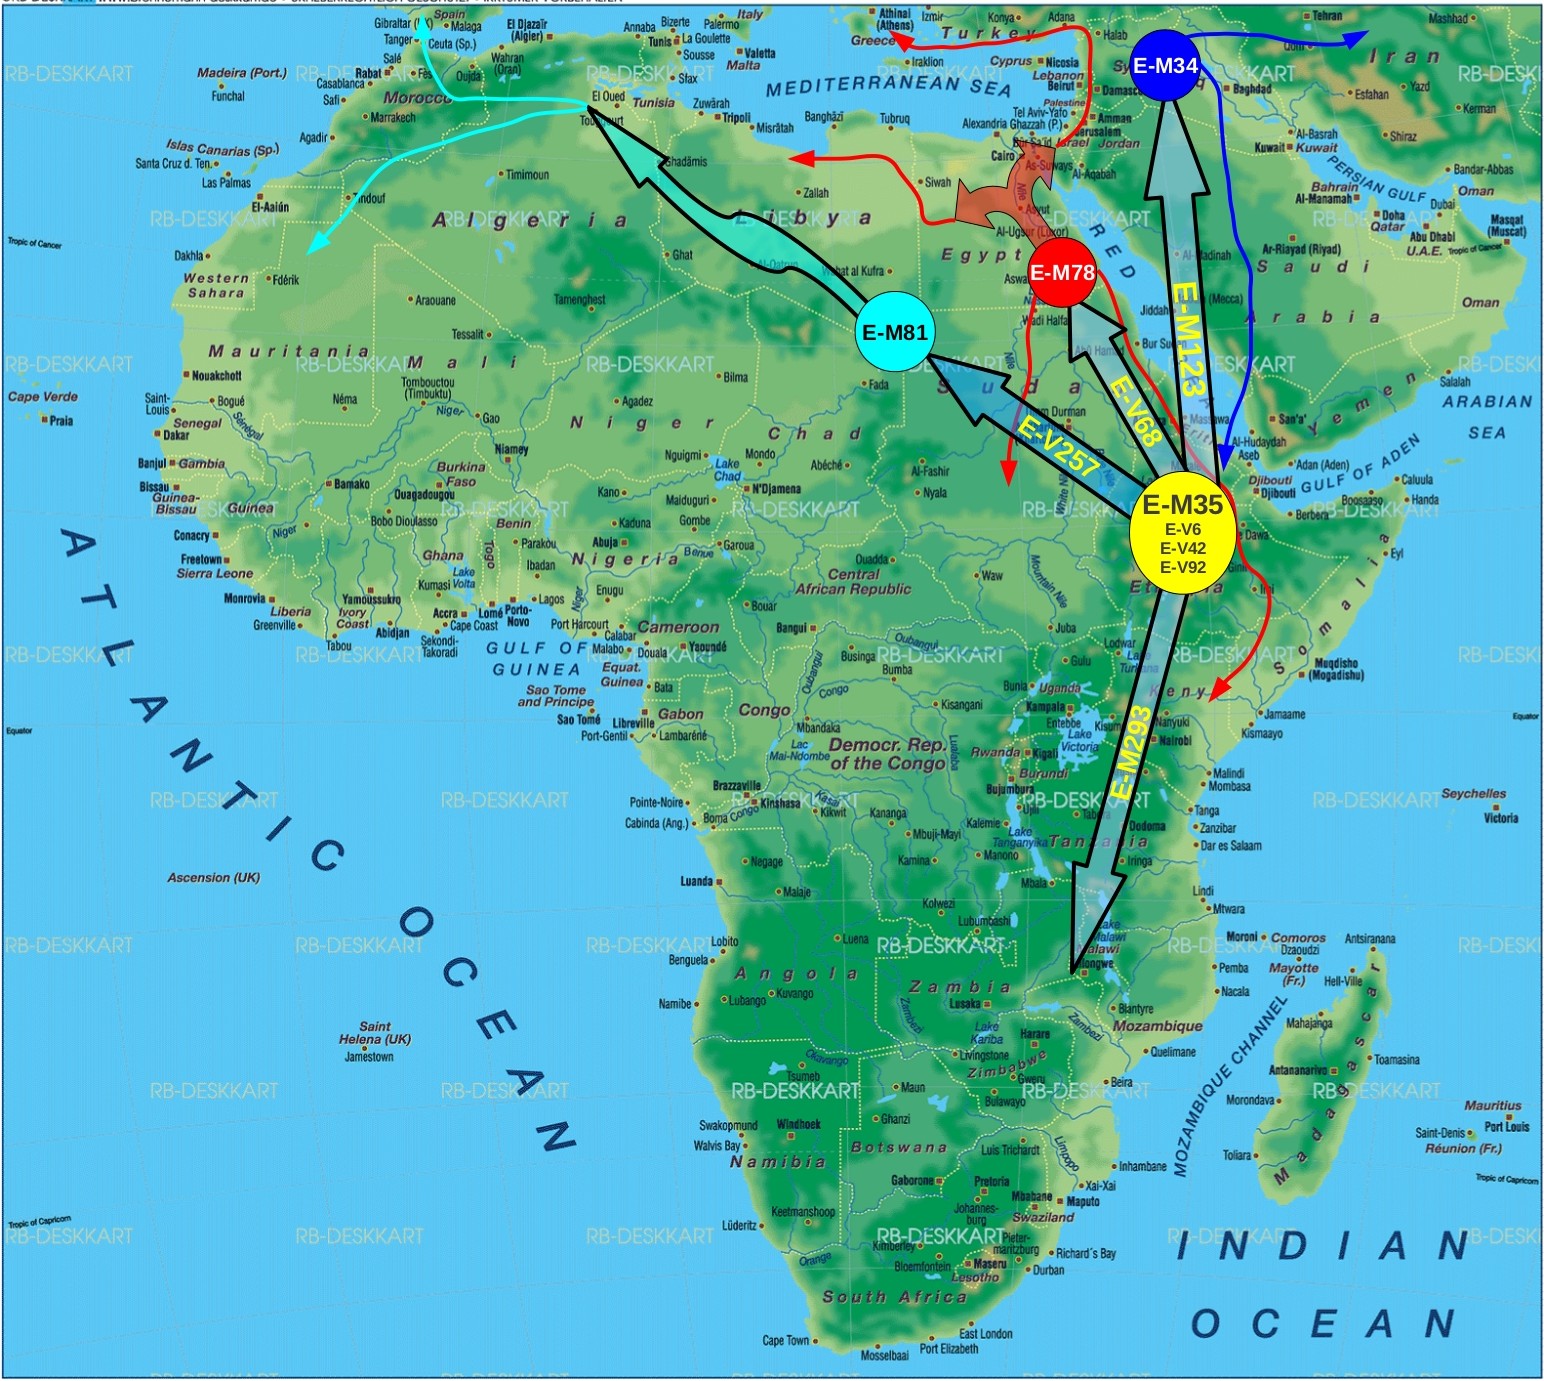
So, as is well known about the spatial frequency distribution of the SNPs, E-M81 (Northwest Africa), E-M123 (Levant) , E-M293 (South and Southeast Africa) and E-V42 (East Africa) I would think , in the absence of a published paper, that the newly found unifying SNP, Z827, would have not occurred very far from where the ancestral SNP (E-M35) would have occurred.
This below is therefore an attempt at the phylogeographic route of E-M35 and its various major and minor subclades since its inception.