|
|
||||
|---|---|---|---|---|---|
|
|
||||
|
|
||||
|
|
||||
|
| ||||
|
| ||||
|
|
Showing posts with label North Africa. Show all posts
Showing posts with label North Africa. Show all posts
Friday, February 15, 2013
Gradient Maps for African ADMIXTURE components
Here below are gradient maps for my last African ADMIXTURE run, Africa_V2b, courtesy of a demo download of Mapviewer7 . The Kriging method was used for Gridding and 'Grid Z limits' mode was used for color mapping.
UPDATE (02/18/2013) : Below are gradient maps for the first African ADMIXTURE run, Africa_V1, courtesy of a demo download of Mapviewer7 . The same options as above were used both for gridding and color mapping.


Tuesday, September 18, 2012
Berber YDNA
Decent resolution composite Berber YDNA from The Berber and the Berbers, Genetic and linguistic diversities, Jean-Michel Dugoujon et. al (2009)
Update: With respect to R-P25 (x M269) found in the Siwa and Mozabite Berbers, there is an even more exact breakdown of the lineage in this table from another publication using the same samples as above. It shows for the Siwa Berbers, the 26.9% of R-P25 (x M269) being further resolved to 23.7 % R-V88* (x M18, V8, V35, V69) plus 3.2% R-V69 (a branch of R-V88), similarly for the Mozabite Berbers, the 3% of R-P25 (x M269) is all resolved to R-V88* (x M18, V8, V35, V69). |
| Phylogeny of the 29 biallelic MSY markers (in bold) tested |
Friday, June 22, 2012


Tuesday, March 6, 2012
Analyzing the North African cluster
Continuing with the Intra-African genome-wide analysis, I wanted to further explore the 'North African'
Cluster that appeared to be wide spread from East to North and West
Africa, 408 individuals out of the 1065 total samples carried the
North African cluster at a frequency greater than 5%. With some of
these populations showing a relatively high Standard deviation
(Normalized with N-1) for that particular cluster.
The table below shows the Standard
Deviation for each of the 10 clusters found in the Intra-African Genome-Wide Analysis.
Yellow; Moderate Standard Deviation,
5-10%
Green; High Standard Deviation, 10-20%
Red; Very High Standard Deviation, >20%
The North African cluster had a high
standard deviation in the Sahara-OCC, Morrocans, SAN, Mozabite and
Morroco-S populations. All of these populations however, excluding
the SAN, carried the North African cluster, on Median, in very high
proportions (> 69%), while the SAN had it on Median only at ~4%.
18 out of the 36 SAN samples did however carry the North African
cluster anywhere between 5-56%. Therefore, I excluded these 18
samples from the 408 individuals who carried the North African
cluster at greater than 5% and proceeded to create a Dataset with
PLINK.
The North African Cluster Dataset
thus included 390 individuals (plus a few private samples) typed at 26,129
SNPs (all other specifications held constant with the previous Dataset).
MDS Analysis
Here below are the MDS plots for the
Dataset, the plots include a 3 Dimensional plot, C1 Vs. C2 plot and
C1 vs. C3 Plot respectively.


The 1St component separates North
Africans from the rest, with Ethiopians and Fulanis located at an
intermediate position in this separation. The
2nd component
separates West Africans from the rest, with Bantus (Kenya and South
Africa) located at an intermediate position in this separation. The
Last and 3rd component separates the Sandawe from
everybody else.
Model Based Analysis.
5 clusters were generated from this
dataset using ADMIXTURE, K=5, Unsupervised. A cluster that peaked in
the Fulani, one cluster that peaked in the Mozabites, another cluster
that peaked in the Sandawe, a fourth cluster that peaked in the
Maasai, which I named East African, and a Last cluster that peaked in
the Egyptians, which I named North East African, were observed. A PCA
for the Fst distances that were generated by ADMIXTURE for these
clusters can be seen below.

The largest vectorized Fst distance is seen for the Fulani, both for components 1&2, while the East African
and Sandawe clusters appear to be close, similar to how the Mozabite
and North East African clusters are close.
A standard deviation table (Normalized
with N-1) for the 5 clusters generated can be seen below.

The Highest Average Standard Deviation
across populations for the five clusters was among the Southern
Morrocans and Mozabites (10.61 and 11.7% respectively).

Above are the Median proportions for
all five clusters in the dataset.
The Mozabite cluster tapers off in a
direction going east from the Northwest of Africa, where it is found at
moderate frequencies in Egypt (~10%), the same can be said of the
Fulani cluster, i.e tapering off in an eastward direction from
Western Africa and found at a moderate (~6%) frequency in the
Sandawe. The Sandawe cluster seems to be restricted to East Africa,
although relatively high frequencies of it can also be seen in
Southern Africa. The East African cluster, which peaks in the Maasai,
is observed throughout East, West and Southern Africa. Finally, the
North East African cluster merges North Africa with East Africa, for
which a major portion can be accounted for with bi-directional Nile
Corridor migrations, in addition to populations that used
to live in the Sahara at a time when the desert was habitable. Minor,
but gradiently significant Extra African input in the formation of
the Mozabite and North East African clusters can also not be ruled
out.
Tuesday, February 28, 2012
Intra African Genome-Wide Analysis
The primary purpose of studying
Haplogroups (NRY and mtDNA) is to describe population movements, AKA
Phylogeography
. Autosomal DNA on the other hand, gives a rather ambiguous
indication of a certain populations Paternal and Maternal history,
since the chromosomes used undergo genetic recombination and can not
be traced back to a single common ancestor. But still, there are
drawbacks in just using NRY or mtDNA to study the history of a given
population, and that is that they constitute only of a single Loci,
which thereby reduce the effective
population size relative to the Autosomes.
To this end, I have utilised publicly
available Genome-Wide SNP data to get further insight into the
population structure of Africa which may not be fully understood only from
the data of uni-parental markers that we have. Perhaps the best
published work out there with respect to African Autosomal
Genome-wide data is that from Tishkoff (2009), this important paper
found 14 ancestral Clusters in the African continent using the most
diverse African dataset to date, however, the paper used Autosomal
Microsatellites and a handful of SNPs.
On a publicly available dataset, I
carried out two of the most popular approaches to help investigate
population structure in Africa using Autosomal genome-wide data; (1)
The non-parametric approach known as Principal Components or Multi
Dimensional Scaling, which uses a Matrix whose elements are the
quantification of the genetic similarity between pairs of individuals, and on which such a Matrix is used
in order to perform a Principal Component Analysis upon, and (2) An
explicit model based population structure analysis using the software
ADMIXTURE, where individuals are assumed to come from one of K
discrete populations and where population membership and allele
frequencies are estimated using a Bayesian modeling strategy.
DATASET
A super set of the Data I used can be
downloaded from here :http://dl.dropbox.com/u/23271596/ref.zip
The global Data Set, compiled by this blog author, contains publicly
available data from 3970 individuals from around the world typed for
27,022 Autosomal SNPs, which can be found all over the 22 pairs of
chromosomes (but not uniformly). I then utilized PLINK to perform
the following on the above Data Set:
- Removed all Non-Continental African populations.
- Removed 18 Tunisians from Henn (2011) as previous analysis had shown independent cluster formation by this group, perhaps a sign of inbreeding.
- Removed 15 Morrocan Jews that came from Behar (2010) for the same reason as above.
- Kept SNPs above 99.46% genotyping success rate.
- Excluded SNPs in linkage disequilibrium (r2>0.5) with nearby markers in a window of 50 SNPs (advanced by 5 SNP).
- Added a handful of private African samples that took their genetic test with the Personal Genomics Company, 23andME. (The results of which I can not unfortunately publish in this post)
The above procedures left me with a
core (public) Dataset of 1,065 Individuals from Africa and 26,129
SNPs for analysis. The complete SNPs typed for these individuals can
be retrieved from: Behar (2010), Hapmap III, Henn (2011), HGDP and
Xing (2010).
Furthermore, geographically, 362 were from East Africa, 304 from West Africa, 158 from North Africa, 142 from Central Africa and 99 from South Africa. Linguistically, the dataset contained 536 Niger Kordofanian speakers, 212 Nilo-Saharans , 211 AfroAsiatic speakers, 89 Khoisans and 17 Hadza.
Update: Reference Populations and Key:


Furthermore, geographically, 362 were from East Africa, 304 from West Africa, 158 from North Africa, 142 from Central Africa and 99 from South Africa. Linguistically, the dataset contained 536 Niger Kordofanian speakers, 212 Nilo-Saharans , 211 AfroAsiatic speakers, 89 Khoisans and 17 Hadza.
Update: Reference Populations and Key:


MDS Analysis
The data for the MDS analysis was
generated using PLINK, while the plots were generated using GNU OCTAVE. A 3 dimensional MDS plot for the dataset can be seen below, all populations are labelled according to their Median Co-ordinates.


Here, we can see that the first
component, C1, separates East and North Africans from
West/Central/South Africans, while the Second Component separates the
divergent hunter gatherers (San,!kung, pygmies and Hadza from the
rest), this may be more clearer on the two dimensional C1 vs C2 plot
below,

The third Component C3, separates East
Africans from all the rest, as more clearly seen on a C1 vs C3 plot
below,

Model Based Analysis
The model based analysis was carried
out for K=10 using ADMIXTURE, thus 10 clusters were generated from the Dataset, I
took the liberty to name these clusters, some on a geographic basis,
others on a linguistic basis and still others on a subsistence basis,
there is obviously a lot of fluidity associated in naming a cluster,
so it shouldn't be taken as something written in stone.
A PCA plot for the FST distances
generated by ADMIXTURE for the 10 clusters can be seen below,

The extreme positioning of the 'Hadza'
cluster is indeed striking, followed by the 'KhoiSan' and 'Pygmy'
clusters. The 'West African', 'West-Central African' and 'Eastern Bantu'
clusters are quite close to each other as can be expected. The
divergence of the North African cluster from East Africa can be
explained by the significant extra African Admixture North Africans
have as evidenced by the amount of their direct maternal ancestries
coming from Europe and the Near East, while a majority of their paternal Ancestry comes
from East Africa (Namely, E1b1b).
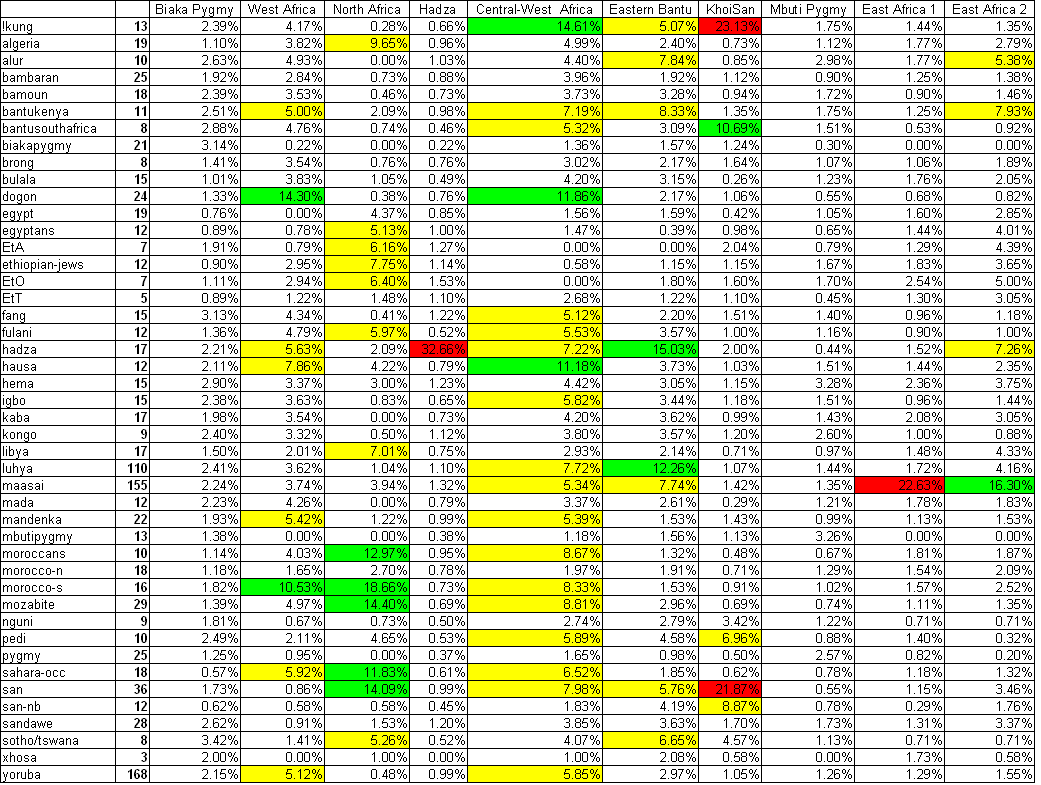
Below are the Median proportions for
the 10 clusters generated by ADMIXTURE for the 45 uniquely entered
African populations categorised according to their 5 respective regions.

The unclear abbreviations above for the
samples of EtA, EtO and EtT are respectively Ethiopian Amharas,
Ethiopian Oromos and Ethiopian Tigrayans, these samples (as well as
the Ethiopian Jews, AKA Beta Israel) come from Behar (2010), in
addition, the EtO samples purportedly come from the southern most tip
of Ethiopia close to the Kenyan border. The dominance of the North
African cluster in Ethiopians is not much of a surprise, as it is
well known that Ethiopia is a genetic conduit between East and
North Africa.

Here, both the mbuti and biaka pygmies
form completely independent clusters, which is not unexpected as
they are some of the most divergent populations even on a global
basis. Also to note, is the slight 'North African' Affinity of the
Hema and the 'West African' affinity of the Bulala and Mada.

Many of the non-Khoisan South African
populations in the Dataset show affinities to both the 'Eastern
Bantu' and 'Central-West African' clusters in almost equal
proportions, which is interesting.

As seen in the PCA plots of the FST
distances, the 'Central-West African', the 'West African',
as well as the 'Eastern Bantu' clusters are close. The Dogon
population however shows the least amount of the 'Central-West
African' cluster and is almost completely dominated by the 'West
African' cluster, which the reverse is true for the Igbo and Yoruba.
Similarly, the Fulani show almost none of the 'Central-West African'
cluster but rather, are mostly dominated by the 'West African'
cluster, with the difference from the Dogon being that the Fulani
have a significant affinity with the 'North African' cluster rather
than the 'Central-West African' one.

In the last graphic above, we can see a
geographic affinity of North West Africans with West African based
clusters and North East Africans with East African dominant clusters,
as to be expected. As stated before however, the 'North African'
cluster itself is likely a both ancient and recent synthesis of East African, European and
Near Eastern Affinities.
Conclusion
I learned quite a bit on the population
structure of Africa from this exercise but there is a lot more room
left for improvement:
- The SNPs that are typed using almost all genotyping arrays are Eurasian biased, as they were first found in Europeans, as time goes on, more African specific SNPs will be discovered and their use in genome-wide analysis will change these results.
- More samples are needed, especially from both South and North Sudan, all along the Sahel belt, Tuaregs, different Omotic speakers from Ethiopia, populations from Mozambique and the South Eastern coast of Africa, as well as the South Western coast (Angola) and many many more. The inclusion of these samples will have an impact on these results.
- More dense SNPs (~200k) may also give slightly different results, although Sikora (2010) notes the following: “We can conclude that the common set of 2841 SNPs genotyped is an appropriate tool to study population structure in African populations; in general, world-wide patterns are evident and robust when using a minimum of 1000 SNPs.”
- Newer and more computer intensive methods for bridging the gap between model based and distance based Autosomal analysis have recently been published, it would be interesting to carry out an analysis of this dataset with these newer methods.
Subscribe to:
Posts (Atom)

 Posts
Posts

