Population References and First Pass K10 Analysis
Finally got some more badly needed genome-wide data from East Africa. 12 sets of populations were added, 9 Afroasiatic (3 Omotic, 4 Cushitc, 2 Semitic) and 3 Nilo Saharan.
I updated my Africa reference map and
table below where the newer populations are to be found indexed from
46-57,


In addition the data was merged with
the older dataset, the bad news is that the genotyping rate for all
the 26,129 SNPs dropped by about 7% to 92.4%, the good news
off-course is that the data I was eagerly anticipating, especially
Nilotic from South Sudan and Omotics from Ethiopia are now available.
When I re-run the model-based analysis
with the same settings, i.e ADMIXTURE K10, the major shifts in the
cluster allocations were that the Mbuti and Biaka Pygmy clusters
combined and formed one Pygmy cluster, the West-Central African
cluster disappeared, and in their place a Nilotic and an Omotic
cluster were formed. There were quite major shifts in the ADMIXTURE
proportions for all the populations except South AFRICA, including
the FST distances where the previous major East African cluster (East
Africa 2) is shifted much closer to the North African cluster:

This is also seen in the ADMIXTURE
proportions where the East African proportion in North Africans is
sgnificantly higher. I will look to update this post with more
analysis but for now:


K2 - K10 Analysis
UPDATE:
Had a chance to rerun the exact same
intra-African dataset as above, but this time for K=2-10, while at
the same time checking for the Cross Validation Error values:
K, CV Error
1 0.58753
2 0.56519
3 0.55874
4 0.55554
5 0.55379
6 0.55315
7 0.55269
8 0.55239
9 0.55215
10 0.55201
As can be seen, the CV Error is still
decreasing, meaning I still have some room to go in my K selection
beyond K=10 for this Dataset.
I have uploaded the full set of
results and processed output (mean, median, standard deviation) for
anybody that may be interested here, but since I do not have time to
plot out each K's results like I did for K10 earlier, I will post the
peaking population breakdowns for each K run as my program tells me,
as well as the Median Values for 3 selected populations: EtA-P (26), ARI-B (17) and
South-Sudan (24):
K2 – East and North Africans split
from other Africans
Cluster1:
morocco-n,egypt,egyptans,libya,algeria
Cluster2:
pygmy,mbutipygmy,biakapygmy,kongo,yoruba
EtA-P
Cluster1 71.94% morocco-n
Cluster2 28.06% pygmy
ARI-B
Cluster2 61.06% pygmy
Cluster1 38.94% morocco-n
South-Sudan
Cluster2 88.06% pygmy
Cluster1 11.94% morocco-n
K3 – West Africans and also Nilotes
split from San/Pygmy (Hunter Gatherers)
Cluster1:
morocco-n,egypt,egyptans,libya,algeria
Cluster2:
yoruba,dogon,bambaran,igbo,brong
Cluster3:
san-nb,san,pygmy,mbutipygmy,!kung
EtA-P
Cluster1 71.22% morocco-n
Cluster2 20.82% yoruba
Cluster3 8.12% san-nb
ARI-B
Cluster1 38.60% morocco-n
Cluster2 36.05% yoruba
Cluster3 24.05% san-nb
South-Sudan
Cluster2 81.62% yoruba
Cluster1 10.20% morocco-n
Cluster3 8.04% san-nb
K4- Nilotes and Omotic Split off
Cluster1:
Gumuz,ARI-B,ARI-C,Anuak,South-Sudan
Cluster2:
morocco-n,egypt,egyptans,libya,algeria
Cluster3:
san-nb,san,pygmy,mbutipygmy,!kung
Cluster4:
yoruba,dogon,brong,igbo,bambaran
EtA-P
Cluster2 55.77% morocco-n
Cluster1 42.46% Gumuz
Cluster3 1.39% san-nb
ARI-B
Cluster1 70.01% Gumuz
Cluster2 18.77% morocco-n
Cluster3 10.01% san-nb
South-Sudan
Cluster1 63.62% Gumuz
Cluster4 35.89% yoruba
K5- Pygmies Split off
Cluster1:
pygmy,mbutipygmy,biakapygmy,alur,fang
Cluster2:
san-nb,san,!kung,xhosa,sotho/tswana
Cluster3:
Gumuz,ARI-B,ARI-C,Anuak,South-Sudan
Cluster4:
yoruba,dogon,brong,igbo,bambaran
Cluster5:
morocco-n,egypt,libya,egyptans,algeria
EtA-P
Cluster5 55.31% morocco-n
Cluster3 41.99% Gumuz
Cluster2 2.10% san-nb
ARI-B
Cluster3 69.58% Gumuz
Cluster5 18.18% morocco-n
Cluster2 9.93% san-nb
South-Sudan
Cluster3 62.81% Gumuz
Cluster4 35.46% yoruba
Cluster1 2.40% pygmy
K6- Hadza Split off
Cluster1:
Gumuz,ARI-B,Anuak,South-Sudan,ARI-C
Cluster2:
yoruba,dogon,brong,igbo,bambaran
Cluster3:
morocco-n,egypt,libya,egyptans,algeria
Cluster4:
hadza,ARI-B,sandawe,ARI-C,Gumuz
Cluster5:
pygmy,mbutipygmy,biakapygmy,alur,fang
Cluster6:
san-nb,san,!kung,xhosa,sotho/tswana
EtA-P
Cluster3 54.93% morocco-n
Cluster1 41.19% Gumuz
Cluster6 1.94% san-nb
Cluster4 1.77% hadza
ARI-B
Cluster1 63.88% Gumuz
Cluster3 17.74% morocco-n
Cluster6 8.12% san-nb
Cluster4 8.10% hadza
South-Sudan
Cluster1 63.97% Gumuz
Cluster2 33.43% yoruba
Cluster5 3.00% pygmy
K7- Omotic Cluster forms
Cluster1:
morocco-n,egypt,libya,egyptans,algeria
Cluster2:
South-Sudan,Anuak,Gumuz,maasai,bulala
Cluster3:
hadza,sandawe,Gumuz,ARI-C,maasai
Cluster4:
san-nb,san,!kung,xhosa,sotho/tswana
Cluster5:
pygmy,mbutipygmy,biakapygmy,alur,fang
Cluster6:
yoruba,igbo,brong,dogon,bambaran
Cluster7:
ARI-B,ARI-C,Wolayta,Gumuz,EtO-P
EtA-P
Cluster1 51.56% morocco-n
Cluster2 27.86% South-Sudan
Cluster7 18.49% ARI-B
ARI-B
Cluster7 98.05% ARI-B
South-Sudan
Cluster2 69.00% South-Sudan
Cluster6 22.88% yoruba
Cluster5 3.72% pygmy
Cluster7 3.51% ARI-B
Cluster3 1.10% hadza
K8- Eastern Bantu Cluster forms
Cluster1:
ARI-B,ARI-C,Wolayta,sandawe,Gumuz
Cluster2:
South-Sudan,Anuak,Gumuz,maasai,bulala
Cluster3:
dogon,mandenka,bambaran,brong,yoruba
Cluster4:
pygmy,mbutipygmy,biakapygmy,alur,fang
Cluster5:
morocco-n,egypt,libya,egyptans,mozabite
Cluster6:
luhya,biakapygmy,bantukenya,nguni,pedi
Cluster7:
san-nb,san,!kung,xhosa,sotho/tswana
Cluster8:
hadza,sandawe,Gumuz,ARI-C,maasai
EtA-P
Cluster5 49.89% morocco-n
Cluster2 25.81% South-Sudan
Cluster1 21.96% ARI-B
ARI-B
Cluster1 96.85% ARI-B
South-Sudan
Cluster2 69.36% South-Sudan
Cluster3 22.68% dogon
Cluster4 4.75% pygmy
Cluster8 1.14% hadza
K9- East Africa2 cluster forms
Cluster1:
san-nb,san,!kung,xhosa,sotho/tswana
Cluster2: Somali,EtS-P,maasai,Afar,EtO
Cluster3:
pygmy,mbutipygmy,biakapygmy,alur,fang
Cluster4:
South-Sudan,Anuak,Gumuz,bulala,alur
Cluster5:
hadza,sandawe,ARI-C,Gumuz,maasai
Cluster6:
dogon,mandenka,bambaran,brong,yoruba
Cluster7:
ARI-B,ARI-C,Wolayta,sandawe,EtO-P
Cluster8:
biakapygmy,luhya,bantukenya,pedi,nguni
Cluster9:
morocco-n,mozabite,egypt,libya,algeria
EtA-P
Cluster9 40.82% morocco-n
Cluster2 29.92% Somali
Cluster7 24.72% ARI-B
Cluster4 3.17% South-Sudan
ARI-B
Cluster7 59.24% ARI-B
Cluster2 16.46% Somali
Cluster4 8.44% South-Sudan
Cluster9 6.70% morocco-n
Cluster1 4.07% san-nb
Cluster5 3.16% hadza
Cluster3 2.15% pygmy
South-Sudan
Cluster4 81.33% South-Sudan
Cluster6 8.64% dogon
Cluster3 2.82% pygmy
Cluster8 1.65% biakapygmy
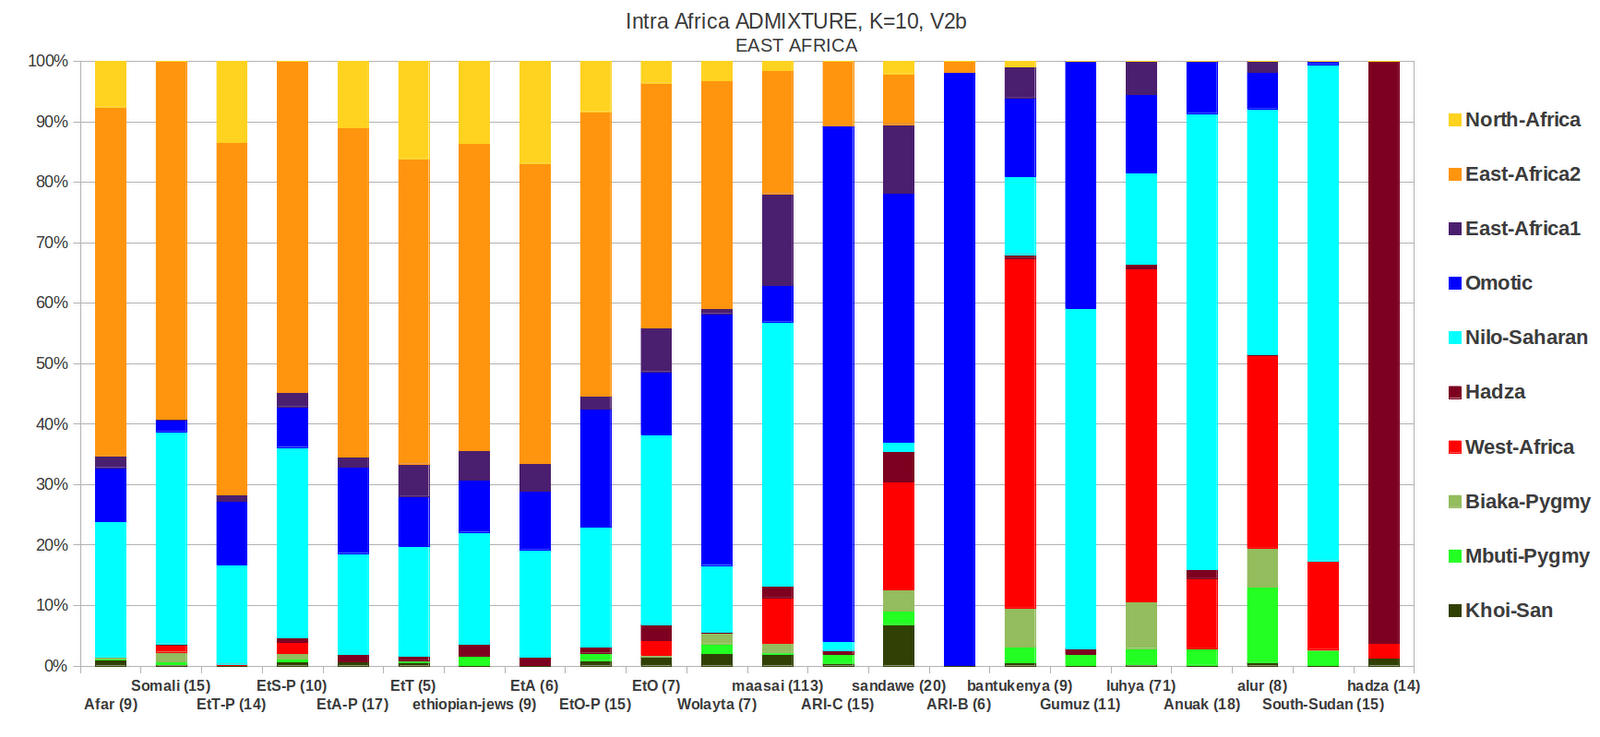
K10- East Africa 1 cluster forms
Cluster1: hadza,sandawe,ARI-C,Gumuz,EtO
Cluster2:
dogon,mandenka,bambaran,brong,yoruba
Cluster3: Somali,EtS-P,Afar,EtT-P,EtA-P
Cluster4:
maasai,sandawe,EtO,hema,ethiopian-jews
Cluster5:
pygmy,mbutipygmy,biakapygmy,alur,fang
Cluster6:
luhya,bantukenya,nguni,pedi,bantusouthafrica
Cluster7:
ARI-B,ARI-C,biakapygmy,Wolayta,Gumuz
Cluster8:
san-nb,san,!kung,xhosa,sotho/tswana
Cluster9:
South-Sudan,Anuak,Gumuz,bulala,alur
Cluster10:
mozabite,morocco-n,sahara-occ,algeria,moroccans
EtA-P
Cluster3 52.46% Somali
Cluster10 19.53% mozabite
Cluster9 13.35% South-Sudan
Cluster7 5.88% ARI-B
Cluster4 3.10% maasai
Cluster1 1.80% hadza
ARI-B
Cluster7 94.69% ARI-B
Cluster3 1.32% Somali
South-Sudan
Cluster9 79.74% South-Sudan
Cluster2 10.27% dogon
Cluster6 4.45% luhya
Cluster5 2.83% pygmy
MDS Plots
UPDATE2: MDS plots based on average coordinates of populations;
 |
| Isometric |
 |
| C1vsC2 |
 |
| C1vsC3 |
Second Pass K10 Analysis
UPDATE3: Removing Outliers.
Based on the previous K10 ADMIXTURE
run, I used a statistical outlier removing method to extract the more
homogeneous samples from the N=1300 dataset. The method looked to
remove samples with a studentization value > 2, this method subtracts the mean of a cluster proportion in a given population from each sample within the population and
divides this value, also known as a residual, by the standard deviation of the cluster for the population to arrive at the studentization value for each sample.
Applying this method removed 392
individuals from across the dataset. In addition, the Pagani
publication had identified 13 Samples that were potentially related
using a PLINK identity-by-descent score of >= 0.125, I also
removed those individuals, this left me with a new outlier removed
dataset of 895 samples.
Rerunning this new dataset using
ADMIXTURE, K=10, reintroduced the Biaka pygmy cluster that had
appeared in my Version one run before
the appearance of the new East African samples from Pagani et. al.
The reappearance of the Biaka Pygmy cluster however meant that the
Eastern Bantu cluster was no longer recognized.
The full results from this new run can
be downloaded from here, and the summary can be found below;


Eurasian Proxy Analysis
UPDATE4 (July 19 2012) : Scenarios for different Eurasian proxies.
Here, I took the outlier removed
dataset from my last run (V2b) and appended to it 3 different
Eurasian proxies and run ADMIXTURE separately, in the first scenario
I added the French from HGDP, in the second scenario I added the
Palestinians from HGDP and finally in the third scenario I added the
Japanese from Hapmap. In all three scenarios, the cluster
distributions as well as relative Fst Distances of the African
components change.
Scenario 1 (+French)
In this scenario, adding the French
removes both the East Africa 1 and 2 clusters and adds the French
cluster while reintroducing the Eastern Bantu cluster. The relative
Fst distances (seen below), shifts the omotic cluster closer to the
French and North African Clusters, in other words the omotic cluster
behaves as a proxy for the East African1 and 2 clusters that were
present before the addition of the French.

Scenario 2 (+Palestinians)
In this Scenario, A Palestinian cluster
along with the Eastern Bantu cluster appear, while the East Africa1
cluster remains, and where East Africa2 and the North Africa clusters
disappear. The Fst differentiates both the Hadza and Palestinians on
the first principal component, unlike with the addition of the
French, where the first PC differentiated mostly the French and North
African cluster, this is likely because Palestinians are closer to
Africans than the French are.

Scenario 3 (+Japanese)
Here, when adding a Eurasian proxy that
is furthest geographically removed from Africa, the East Africa 2
cluster disappears to make way for the Japanese cluster. All other
clusters remain in their previously peaking populations. As this
approximates a global analysis, the first PC of the Fst
distances separates solely the Japanese from all Africans, where
the North African cluster occupies a slightly intermediate (albeit
closer to Africans) position.

The mean frequencies for all 3
scenarios (plus the original V2b run) and the sampled populations can be found below.
Final ADMIXTURE Results Summary (GEDMatch Submission)


Quick work. I'm impressed. It used to take months or years for new papers to get integrated into comprehensive overviews the way that you did in a matter of hours.
ReplyDeleteThe publishers had the dataset in PLINK format already, so all I had to do was merge it with my previous dataset and re-run ADMIXTURE on it. I still need to run the MDS plots however, which I'll do tomorrow. In any event, the addition of the Nilotic and Omotic clusters at the expense of the West-central African and one of the pygmy clusters is quite interesting, also the fact that the minor East African cluster (East Africa 1) remained intact....
DeleteThis comment has been removed by the author.
DeleteHmm... interesting but up to a point. You did not run other K-levels (always useful to contrast) and you run the regional datasets only in supervised manner, what is a complementary way of analysis but one I consider less interesting than the unsupervised, where the intrinsic variation comes out on its own.
ReplyDeleteFinally it'd be interesting to check vs. WEA populations at least Fst-wise, maybe in a separate analysis but it can give very interesting information in any case.
Most interesting maybe is the main K=10 analysis that does bring to light several East African apparent components, even if we ignore the Hadza (what we should because their distinctiveness is clearly product of inbreeding) but again it could be better evaluated if we had some other K-levels to compare with.
Sorry for the moderation, I have trolls spamming this place, which left me with no choice.
Delete“Hmm... interesting but up to a point. You did not run other K-levels (always useful to contrast)”
True, I didn't have the time to go through each K run, my computer is pretty slow too, I plan on doing that with the global dataset as time permits however.
“and you run the regional datasets only in supervised manner,”
That is absolutely not true Maju, where did you get that? I ran it exactly the same way as the Intra African Genome-Wide Analysis, V1, the only difference is that I added these 235 samples, which gave me a total of 1300, and that my genotyoping rate went down a bit, as I mentioned in the post, other than that this is an intercontinental unsupervised K=10 run just like V1.
“what is a complementary way of analysis but one I consider less interesting than the unsupervised, where the intrinsic variation comes out on its own.”
Again, it is unsupervised, please see above.
“Finally it'd be interesting to check vs. WEA populations at least Fst-wise, maybe in a separate analysis but it can give very interesting information in any case.”
Yes, as time permits, I will integrate the data to my global dataset and run it up to K=13, like I did here:
Cross Validating and K Selection
“Most interesting maybe is the main K=10 analysis that does bring to light several East African apparent components, even if we ignore the Hadza (what we should because their distinctiveness is clearly product of inbreeding) but again it could be better evaluated if we had some other K-levels to compare with. on Intra African Genome-Wide Analysis, V2”
The main difference between the V1 run is that the Pygmy clusters collapse into one and the West-Central African cluster disappears, these are then replaced with the Omotic and Nilotic clusters. However, while the Eastern Pygmies come out with the full Pygmy cluster membership, the Western Pygmies (Biaka) appear to have a multiple membership in the Omotic, Khoisan, Eastern Pygmy and Eastern Bantu clusters. The North Africans also do not seem to be Dominated with just North African cluster any longer, instead the major East African cluster (East Africa2) has a much more significant assignment in them than in my first version run, also Ethiopians have less of the North African cluster , which goes to show how adding these new populations completely changes the overall dynamics, as I had suspected.....
"That is absolutely not true Maju, where did you get that?"
DeleteHmmm... otherwise you would not get Hadza component, even if it's a thin layer one pixel thick, anywhere but among the Hadza (and maybe some in the Sandawe). In the regional plots you must be using pre-determined "zombie" components obtained from the general African run.
I'm not sure if "supervised" is the right word but otherwise you would not get most of those components for example among North Africans (which I am most familiar with) but instead internal subdivisions.
That's also the case in the V1 exercise. Maybe you just run one single pan-African comparison and then cut up the graph by regions?
"The North Africans also do not seem to be Dominated with just North African cluster any longer, instead the major East African cluster (East Africa2) has a much more significant assignment in them than in my first version run, also Ethiopians have less of the North African cluster , which goes to show how adding these new populations completely changes the overall dynamics, as I had suspected....."
This part is potentially interesting although I gather from the PC graph that the two components are not too distinct from each other and must have quite low Fst distance between them. So I'm not really sure of its significance.
It's difficult to evaluate with the data you produced but it's behavior is very similar to that of the Ethiopian-specific component I gathered in my analysis of North Africans (plus controls). Maybe a bit stronger in appearance (surely because other North African layers are eclipsed here) but overall quite similar: minor in North Africa in general with quite greater weight in Egypt and Libya (but still minor).
This component I thought back in the day that it is indeed a deeply rooted Ethiopian component but also a the product of ancient admixture between West Eurasian back-migrants and Native Tropical Africans. Why?
1. The component takes long to show up (only since K=10) and earlier it appears divided between the West African and the Arab component.
2. The Fst values are almost exactly equidistant between West Eurasian (incl. most North African) components and Tropical African ones.
So IMO this Ethiopian or East Africa 2 component is the homogenized product of an ancient admixture, surely dating to the Paleolithic.
So in the end the dynamics has not really changed: it is with all likelihood the same component I detected in my little North African exercise, just that somewhat aggrandized in its influence because of a different focus in the analysis.
"Maybe you just run one single pan-African comparison and then cut up the graph by regions?"
DeleteExactly that is what I did, both V1 and V2 are Just 1 Pan-African run each @ K=10, both UNSUPERVISED, there is a clear distinction in the ADMIXTURE software for running supervised or Unsupervised runs, I chose the latter, No Zombie populations were involved, the regional graphs are strictly and only for ease of visualization. of the results. Any body can try the experiment on their own,
I have already put up the link to the original Africa dataset (V1) here: http://ethiohelix.blogspot.com/p/public-data-sets.html
All, one has to do is incorporate the data from Pagani, which you can find here: http://mega.bioanth.cam.ac.uk/data/Ethiopia/
Then, when merging you have to flip the strands of about 8,000 SNPs or so otherwise it won't work.....
I will respond to your other comments a little later...
"Then, when merging you have to flip the strands of about 8,000 SNPs or so otherwise it won't work....."
DeleteEasily said... I can manage the 1000 genomes dataset but no idea beyond that.
Maju, when you first try to merge them WITHOUT flipping, PLINK gives you an error, but it also gives you a file with a list of the SNPs that are causing the problem, what you then need to do is take that file and save it as a .txt file, then run this command on the old dataset, i.e the one that you want to merge:
Deleteplink --bfile Africa_Rev4_public --flip Africa_Rev6.txt --recode --make-bed --out Africa_Rev4_public_flipped
what this command will do is take the file from the original, called "Africa_Rev4_public", flip the SNPs from the list that you saved as .txt file, called "Africa_Rev6.txt", and make a new .bed file called "Africa_Rev4_public_flipped". With this new file you will be able to merge with the Pagani set after you extract the common SNPs from there as they have over a million SNPs....
I really appreciate your help Etyopis but it really gets over my head. I need a windowed tutorial to be able to use almost any software. I'll leave the complications to the younger generation (or at least the ones who have a young mentality, eager to climb over the obstacles and learn in the process, as you do).
DeleteI have updated for K2-K10 run....
DeleteIt looks like the authors of the study mistyped the identities of the individuals identified as being Afar. According to Table S1. Sample Size, Location, and Sociological Features of the Genotyped Populations in the supplementary data, these "Afars" speak an Agaw language, i.e. Xamtanga, and they're located in the Wag Herma zone in northern Amhara; they're are also referred to as highlander agriculturists.
ReplyDeletehttp://download.cell.com/AJHG/mmcs/journals/0002-9297/PIIS0002929712002716.mmc1.pdf
http://en.wikipedia.org/wiki/Xamtanga_language
http://en.wikipedia.org/wiki/Wag_Hemra_Zone
I'm assuming that we didn't get any true Afar samples in this new study; but nevertheless, non-Beta Israel Agaw samples who are much more closer to the Afro-Semitic references, i.e. Amhara and Tigray, than the former.
Thanks for the information, I will look into it. It seems odd that the researchers (of which a couple are Ethiopian) would confuse Afars with agews from wag (the traditional place of the Wag-shum, heirs of the Zagwe Dynasty), this is not something even a lay Ethiopian would confuse, but like I said I'll look into it.
DeleteLooking at that table if it was indeed Agews from wag instead of the Afar they sampled, then the elevation listed would also be wrong, the elevation listed is more indicative of lowland areas, like where the Afar live and not where Wag or Lasta is , which is well in the Ethiopian highlands. I think it really was the Afar that were sampled, just a typo in some of the labelling like location, subsistence and language, or they could have physically sampled some Afars that were in wag but incorrectly listed their sampling locations instead of where the Afar are traditionally found.
Deleteidk These "Afar" samples are practically identical to other northern highlander ethnicities like the Amhara, Beta Israel, and Tigray. Surprising given their cultural and linguistic affinities, not to mention location; I find it very unlikley that the Afar, being lowland Cushites, are more similiar, if not identical, to Habeshas than they are to more closely related groups like the Somali who they happen to share a country with, i.e. Dijibouti.
Delete@Anon: Djibuti is an artificial modern, post-colonial, state, which does not mean anything in ethnic or historical terms. Geographically, the Afar country is to the West of the Rift and bordering the Amhara and Tigray countries. It may be a peculiar lowland area but I doubt that lowland-highland distinction alone is so important.
DeleteAnyhow Somalis are not that different from Afar or other Horner peoples, which are essentially (at K=10) a base of East Africa 2 with some Nilotic (and in some cases other stuff, notably North or West Africa affinity, although I bet the North Africa component hides an Arabian affinity instead).
It's also very possible that Somalis from different areas have somewhat different compositions. It's surely not the same a Somali from Mogadishu than one from Somaliland, etc. Maybe Somalis from the Gulf of Aden area are also closer to the Amhara-Tigray, as well as to Arabs (not obvious but probably hidden in the North Africa affinity component).
Depends how you look at it, on a global level, K=14, (which I haven't published a post on), most of the Afroasiatic East Africans including the Somalis but excepting the omotics are quite similar, with about the same (+/-10%) composition of Nilotic/Omotic + South West Asian + North West African components. The South West Asian, although peaking in the inbred Bedouins, is likely a hybridized cluster of OOA +African Upper-Palaeolithic + S.West-Asian Neolithic, while the North West African is likely a hybridized cluster of European Palaeolithic + African + South West Asian.
DeleteOn an African level, as you can see in the current post, the Afar have slightly more East African2 and NiloSaharan than the highlanders, not by much, while the Somalis on top of having the highest East African2, also have more Nilo Saharan and West African than everyone else including the Wolayta and other Omotics (Perhaps a sign of Somali Bantu Introgression ??). Also, Afar/Saho is thought to be Linguistically 'ancestral' or diverged earliest from all other Lowland East Cushitic languages, and thought as one of the trifurcation components of Eastern Cushitic (the other components being Highland East Cushitic and Mogogodo/Tsamai languages)
I will update this post with my 3D intra African MDS soon.....
@ Maju
DeleteThere are about twenty some Somali individuals from 23andme being circulated among the various active amateur bloggers interested in further comprehending the genetic affinities of NE Africans and Africans in general, inshallah, and they indicate a fairly straightforward story. These individuals are from an array of different locales throughout East Africa, i.e. from Djibouti to inner Ethiopia to eastern Ethiopia to Kenya, and all of the individuals have been extremely homogeneous so far.
The highlander vs. lowlander distinction in NE Africa likely played a fundamental role in the sub-structure, in relation to Eurasian admixture, in the region. The relatively "recent" introduction of Yemeni-like gene-flow into NE Africa was likely stimulated by the agricultural potential in the highlands, something that wasn't the case in the arid and desert-like lowlands surrounding the northern highlands. So far, all sampled lowland groups, for example the Borana Oromo and Somali, have been notably divergent in relation to Beja, Agaw, and Afro-Semitic speaking populations in the Eastern Sudan, Eritrea, Tigray, Amhara, and northern Oromia.
edit: According to this aforementioned study, the Somali samples are from Somaliland in northernmost Somalia. In addition, the Ethiopian Somali seem to be from the general Hararge region of Oromia, Ethiopia which borders the Afar region to the immediate south.
At the end of the day, the fact that these "Afar" samples are listed as Xamtanga (Agaw) speaking, agricultural highlanders from the Wag Herma zone in northern Amhara, in addition to clustering in the same vicinity as other highlanders indicates that they are not Afar.
@Etyopis
Delete''On an African level, as you can see in the current post, the Afar have slightly more East African2 and NiloSaharan than the highlanders, not by much, while the Somalis on top of having the highest East African2, also have more Nilo Saharan and West African than everyone else including the Wolayta and other Omotics (Perhaps a sign of Somali Bantu Introgression ??).''
You must be playing really stupid if you think that's the case. It's obvious that some of your clusters are unstable due to the fact that you did not prune for relatives. Also, if you play close attention to your own run the so-called ''Eastern Bantu'' cluster is not present in most Somalis. So before you claim any nonsense like this at least think critically.
Also, here is a global run I did on the same Pagani data-set, including some Somali fiends from various backgrounds (both from the South and North), and the vast majority of Somalis have at higher K levels no West African whatsoever, while it is still very much present in Bantu East Africans and Nilotic Sudanese. Clearly indicating that Bantu ancestry is not present in most ethnic Somalis. See the spreadsheet below:
https://docs.google.com/spreadsheet/ccc?key=0AqWOT2m6btAGdEpjTExTRG1NU1NKRnJfd3hOeWkwdkE#gid=8
@Anonymous
Delete''edit: According to this aforementioned study, the Somali samples are from Somaliland in northernmost Somalia. In addition, the Ethiopian Somali seem to be from the general Hararge region of Oromia, Ethiopia which borders the Afar region to the immediate south''
Actually they are a random group of immigrants living in Pakistan per the study, they weren't sampled inside Somalia. I doubt they are from the same place, given the fact that none of them is closely related or shares significant IBD.
@Maju,
Delete''It's also very possible that Somalis from different areas have somewhat different compositions. It's surely not the same a Somali from Mogadishu than one from Somaliland, etc. Maybe Somalis from the Gulf of Aden area are also closer to the Amhara-Tigray, as well as to Arabs (not obvious but probably hidden in the North Africa affinity component).''
No, not really, you shouldn't just assume things. They are basically the same. I have Somali friends from Southern regions who took a 23andMe test and they are basically identical to Northern Somalis. There is no ancestry difference them. There is no Arab ancestry whatsoever in Northern Somalis, which some people seem to sometimes incorrectly assume. Northern Somalis are actually ethnically a branch/sub-set of Southern Somalis who took up camel pastorlism about 2,000 years ago.
@Eze and Anon.: I take notice of your surely best informed comments and stand corrected. Thanks for the feedback.
Delete@Eze
Delete"You must be playing really stupid if you think that's the case. It's obvious that some of your clusters are unstable due to the fact that you did not prune for relatives."
Not sure what exactly you mean by unstable, but I have run the dataset several times and get the same results, I have also run it with cross validation, anybody can rerun this data as I have already posted the input files like I explained to Maju earlier. All the new Afroasiatic East Africans sampled from Pagani in my run (including both Omotics) have an average of 0.31% West African Cluster and 13.05% Nilotic, While the Ethiopian Somalis have 4.44% West African and 21.38% Nilotic, and the other Somalis have 3.46% West African and 22.81% Nilotic. So there is obviously higher affinity, which can not be simply explained by geography since Somalis are the Eastern most African Afroasiatics and all the remaining AA samples are geographically in between them and Nilotes, I simply proposed a possibility for this higher affinity relative to the other East Africans, as you recall also the L3 mtDNA Somali study from Soares earlier this year also had a handful of L3e samples in the Somali data.
As far as the Eastern Bantu cluster missing in the Somali, yes, I did notice that, but the bantu Kenyans and the Luhya also had the West African as well as the Nilotic cluster in fairly significant amounts, in addition to the fact that the Eastern Bantu cluster is relatively close to the aforementioned clusters in terms of FST, thus making them more prone for probabilistic allele assignment confusion with each other.
Like I said, it is just a possibility.........
@ Anon:
The Afar samples will be considered as Afar and nothing else unless you bring concrete proof from the publishers themselves that they indeed are not Afar.
@Etyopis,
DeleteIt's not a possibility at all. There are several clues which completely refute that.
Regarding that Soares study, they clearly included some actual minority groups and not only ethnic Somalis (there were some odd recent Eurasian lineages present as well). Just like in Ethiopia, not everyone is ethnically the same in Somalia. So it's useless to bring it up. However, we are dealing with homogeneous ethnic Somali Somalian samples in Pagani's study.
Secondly, look at K7 of my run here:
https://docs.google.com/spreadsheet/ccc?key=0AqWOT2m6btAGdEpjTExTRG1NU1NKRnJfd3hOeWkwdkE#gid=5
The Somalia Somali samples in here get on average get 0% 'Omotic', 54% 'Nilo-Saharan', 0% 'West African', 46% 'Arabian/Red Sea'.
If you look at the same sheet, Luhya Bantus and Nilotic Sudanese still have a high fractions of West African ancestry, while it's not present in Somalis.
Clearly we are dealing with something very ancient that simply can't be explained by recent Bantu or Nilotic slavery. Also, if you know anything about Somali history you should know that slavery was only a fairly recent event (instigated by Arab/Portuguese merchants) which can't have affected the main nomadic ethnic Somali population who didn't participate in it. The fact that these Somalian samples show an equal distribution of these clusters also goes completely against such crazy ideas. A population affected by recent slavery would behave like those Yemeni Arab samples from Behar who behave very heterogeneous, this is not the case with these homogeneous Somalian samples.
What is very clearly is that Somalis from Somalia lack a hunter-gatherer affinity that's present in Omotic people. This is also clearly visible in your PCA plots.
What possibly could explain this is that the original Cushites were an Upper Egyptian or North Sudanese-like population with both Nilo-Saharan and North African genetic affinities that entered the Horn. The Cushites who entered the highlands encountered Omotic people and mixed with them, while those who entered the semi-arid lowlands probably didn't encounter Omotic people and hence the lack of Omotic and/or significant hunter-gather ancestry in most present-day eastern lowlanders. Considering that the Cushitic ethnogenesis has been placed in North Sudan by some this could very will be true.
Yes! Xamtanga/Agaw speaking Afars from Weg Herma zone, Amhara who somehow abandoned their nomadic way of life and took up farming in the northern highlands. lol Some of us are attempting to contact the authors for further clarrification.
Delete@ EZE,
DeleteI am not discounting your theory but I just processed your data @K7, The ESomalis(17) had the 'West African' on Median at 0.00% while the Somalis(23) had it at 0.00%, my Global K7 run however begs to differ, the Esomalis(17) had the West African or Cluster6 at 7.35%, while the Somalis(23) had it at 7.16%, again higher than the other Pagani East African AA samples average. My global dataset had a lot more entries from around the world too (184, N=2967), versus yours (59, N=852), the global cluster break down was also very different, Omotic and Nilo-Saharan have not broken up and they don't break up even at K14, and there was no Arab cluster but rather a West Asian cluster that peaked in the Basques and Sardinians, In addition there was a papuan/SouthAsian cluster as well as a San/Pygmy one. My K7 Global results are available here .
Etyopis,
DeleteWell, my run was focused primarily on Africa and West Eurasia and I also used ~160,000 SNPs (99% call rate, --geno 0.01 and --indep-pairwise 50 5 0.3) instead of the ~26,000 SNPs you used.
Also, as I said before there is something wrong with your clusters because you still haven't pruned out those Aari, Hadza, Maasai relatives (siblings and first cousins!) out. Since Ethiopians have Omotic ancestry this would work in favor of Ethiopians and pushing alleles of non-Omotic mixed Somalis into other clusters. So prune out those relatives, get an Omotic and Nilo-Saharan cluster in an intra-African or intra-Africa-West Eurasia run, and then compare your results to mine. It should be roughly the same.
Eze,
DeleteI am not going to cherry pick samples, if it is an African run, then all continental African populations I have available will be included, within reason off-course, like the well acknowledged and obvious inbred Tunisian and Moroccan jew samples were discarded, likewise if it is a global run then ALL global populations I have available will be included, I am trying to get a full picture of population structure on an African and Global level and not tidbits here and there, the density of your SNPs were definitely larger than mine, I'll give you that, but so did the run included in the Pagani study have higher density SNPs, yet my results just as there's shows a slightly higher level of Nilotic and West African in the Somali samples than the remaining E. African AA samples, starting from K4 and up for West African and from K6 and up for Nilotic.
Who said anything about cherry picking samples? All I said is to remove samples with IBD/PI_HAT > 0.125, which is basically step 1 when one performs an admix/structure run (you basically keep forgetting this).. Anyhow, with a few distinct non-inbred East African clusters the Pagani Somalia samples show no Bantu ancestry at all, which is basically what this whole argument started about.
DeleteWhat possibly could explain those patterns you notice is either 1) A very old but minor Nilo-Saharan-Cushitic admixture event which affected the proto-South Lowland E. Cushitic group when they expanded southwards thousands of years ago. OR.. 2) A higher retention of Nilo-Saharan/Egyptian related ancestry from the original Cushitic expansion from North Sudan into the Horn. In the Ethiopian highlands this was lowered by both Omotic/hunter-gather and by a second wave of North African or Southwest Asian admixture. This to me does not seem like a far-fetched idea, but quite possible.
Why do the Behar et al. Amhara and Tigray have less East-Africa1, along with more East-Africa2 and North-African than the new Amhara and Tigray samples? The East-Africa1 component is higher in all of the Behar samples (Jews and Oromos as well) than the Pagani samples.
ReplyDeleteYeah you are right, although the differences are about ~5% ,Here are more exact percentages, the populations to the right are the peaking populations of each cluster
DeleteEntry = EtA
UniquePop # 6 / 57
N = 7
K = 10
Means
Cluster3 43.91% Somali
Cluster10 25.82% mozabite
Cluster9 14.72% South-Sudan
Cluster4 6.73% maasai
Cluster7 3.93% ARI-B
Cluster1 2.30% hadza
Cluster6 1.03% luhya
Total 100.00
Medians
Cluster3 42.79% Somali
Cluster10 26.62% mozabite
Cluster9 14.20% South-Sudan
Cluster4 6.11% maasai
Cluster7 4.20% ARI-B
Cluster1 1.86% hadza
Total 96.54
Closest Population EtT
Entry = EtA-P
UniquePop # 7 / 57
N = 26
K = 10
Means
Cluster3 52.81% Somali
Cluster10 19.38% mozabite
Cluster9 13.30% South-Sudan
Cluster7 6.45% ARI-B
Cluster4 2.68% maasai
Cluster1 1.72% hadza
Cluster8 1.21% san-nb
Cluster2 1.04% dogon
Total 100.00
Medians
Cluster3 52.46% Somali
Cluster10 19.53% mozabite
Cluster9 13.35% South-Sudan
Cluster7 5.88% ARI-B
Cluster4 3.10% maasai
Cluster1 1.80% hadza
Total 97.46
Closest Population EtT-P
Entry = EtT
UniquePop # 11 / 57
N = 5
K = 10
Means
Cluster3 45.89% Somali
Cluster10 25.09% mozabite
Cluster9 14.40% South-Sudan
Cluster4 5.72% maasai
Cluster7 2.52% ARI-B
Cluster6 2.44% luhya
Cluster2 1.57% dogon
Cluster1 1.29% hadza
Total 100.00
Medians
Cluster3 45.22% Somali
Cluster10 25.23% mozabite
Cluster9 13.45% South-Sudan
Cluster4 5.54% maasai
Cluster6 2.76% luhya
Cluster7 2.49% ARI-B
Cluster1 1.52% hadza
Cluster8 1.16% san-nb
Total 97.38
Closest Population EtA
Entry = EtT-P
UniquePop # 12 / 57
N = 21
K = 10
Means
Cluster3 53.93% Somali
Cluster10 21.06% mozabite
Cluster9 12.72% South-Sudan
Cluster7 5.07% ARI-B
Cluster4 1.87% maasai
Cluster2 1.67% dogon
Cluster6 1.13% luhya
Total 100.00
Medians
Cluster3 54.23% Somali
Cluster10 21.69% mozabite
Cluster9 12.90% South-Sudan
Cluster7 4.74% ARI-B
Cluster4 1.26% maasai
Total 97.50
Closest Population EtA-P
contd....
Entry = EtO
DeleteUniquePop # 8 / 57
N = 7
K = 10
Means
Cluster3 41.12% Somali
Cluster9 24.63% South-Sudan
Cluster10 10.76% mozabite
Cluster4 9.35% maasai
Cluster7 4.42% ARI-B
Cluster6 2.73% luhya
Cluster1 2.69% hadza
Cluster2 1.71% dogon
Cluster8 1.62% san-nb
Total 100.00
Medians
Cluster3 41.65% Somali
Cluster9 26.84% South-Sudan
Cluster4 9.84% maasai
Cluster10 9.64% mozabite
Cluster7 3.80% ARI-B
Cluster6 3.35% luhya
Cluster1 2.78% hadza
Cluster8 1.85% san-nb
Cluster2 1.60% dogon
Total 101.64
Closest Population EtO-P
Entry = EtO-P
UniquePop # 9 / 57
N = 21
K = 10
Means
Cluster3 45.78% Somali
Cluster9 17.36% South-Sudan
Cluster10 15.15% mozabite
Cluster7 11.65% ARI-B
Cluster4 3.38% maasai
Cluster5 1.75% pygmy
Cluster1 1.69% hadza
Cluster8 1.50% san-nb
Cluster2 1.08% dogon
Total 100.00
Medians
Cluster3 47.19% Somali
Cluster9 17.52% South-Sudan
Cluster10 15.23% mozabite
Cluster7 11.99% ARI-B
Cluster4 2.25% maasai
Cluster1 1.66% hadza
Cluster5 1.63% pygmy
Cluster8 1.15% san-nb
Total 98.91
Closest Population EtA-P
My suspicion is that it has to do with the intersection of the old (my V1 dataset) SNPs with the Pagini data, as I noted in my post the resulting dataset incurred a slight loss (~7%) in the genotyping rate....
Interesting. Having had a quick look at the Pagini paper, its focus is Ethiopians. Outside Ethiopia, it heavily samples the Maasai and a few other Nilotic speakers. Other Nilo-Saharan speakers of the Sahel are not sampled, so I think that may throw off an ADMIXTURE run.
ReplyDeleteIn any case, your ADMIXTURE run does show that the Maasai are a eclectic group. Tishkoff indicates that in her papers as well. Interestinly, your ADMIXTURE run also shows that the Gumuz, who linguistic evidence indicates speak a very early form of Nilo-Saharan (Ehret), do show up as being mostly Nilo-Saharan (Nilotic).
It be good if there were a few more Afroasiatic samples. The Beja are obvious in their absence. (They are in Tishkoff.)
I also took a look at their model based analysis, in essence the difference between this run and theirs are in (a) SNP density (theirs was much higher) and (b) populations sampled, I believe this run had more populations included in it, the software they used off-course was ADMIXTURE, same as here. In terms of populations in their dataset, the only one I do not have included here are the French, other than that, this dataset actually had more Central Africans, including the Bulala, fang, hema... ; more Southern Africans, including the Pedi, Nguni and Xhosa; more West Africans, including the Dogon, Fulani, Hausa, Bambaran.... and more North Africans, including the Libyans, Algerians and Various Moorrocans.
DeleteThat said, there was congruency in population structure and the progression of the K variable between this run and theirs, however, the congruency breaks down at K=6 and on, if you notice on their run the Pygmies first split off at K=5, but then at K=6 the pygmies do not form their own cluster and instead the omotics and Hadza create their own cluster, however in my run the pygmies still maintain their cluster at K=6 while the Hadza emerge with a new cluster as well and Omotics do not get their own cluster till K=7, so from here on (i.e. K=6) we start getting different components (some what to an extent), including the fact that in their run the Lhuya and Bantu Kenyans do not get their own cluster, which I named 'Eastern Bantu', and off-course my run goes up to K10, while theirs stops at K9, I still have room for a couple of clusters according to the CV error values generated by ADMIXTURE for my dataset.
As far as the cluster naming Nilo Sahran vs. Nilotic, although model-based cluster names are fluid and not set in stone, yes I agree Nilo Saharan may have been more appropriate.
Looking again at your ADMIXTURE chart for East Africa, I believe Nilotic should be renamed Nilo-Saharan.
ReplyDeleteOverall an interesting admix run, although it looks like you haven't pruned for relatives (PLINK IBD/PI_HAT > 0.125), which is a must in order to get more stable clusters. A large portion of the Blacksmith Ari, Hadza, and Maasai are siblings and/or first cousins.
ReplyDeleteTrue, I have not run IBD neither on this Dataset or the previous one (V1), however, I get the same general cluster progression as the authors do, Like I explained earlier to Marnie, however, they, i.e. Pagani 2012 did do some IBD pruning on their dataset, so I am not sure it would make a big difference.
DeleteI don't think Pagani 2012 did any IBD pruning in their structure data set, because from the chart it includes many Hadza, Maasai, and Blacksmith Ari, who otherwise wouldn't make it with an IBD/PI_HAT > 0.125 criteria. You can test it out yourself, if you do it correctly you should end up with only few/handful of them. Ari cultivators are mostly outbred though.
DeleteRead the Materials and Methods section of the study (if you have access to it):
Delete“The merged data set was pruned to remove SNPs in high LD (r2 > 0.1), and ADMIXTURE analyses were run as described33 after removal of samples showing high relatedness (PLINK identity-by-descent score >= 0.125) with any other sample in the same population (1 Amhara, 2 Ari Cultivators, 6 Ari Blacksmiths, 3 South Sudanese, and 1 Gumuz).34 Cross vali-dation was used to estimate the optimum number of clusters (K).”
They even have the 13 individuals they removed labeled in their .fam file, (even though I did not take them out for my run):
ARIBLACKSMITH13IBD ARIBLACKSMITH13IBD
ARIBLACKSMITH14IBD ARIBLACKSMITH14IBD
ARIBLACKSMITH15IBD ARIBLACKSMITH15IBD
ARIBLACKSMITH16IBD ARIBLACKSMITH16IBD
ARIBLACKSMITH18IBD ARIBLACKSMITH18IBD
ARIBLACKSMITH17IBD ARIBLACKSMITH17IBD
ARICULTIVATOR23IBD ARICULTIVATOR23IBD
ARICULTIVATOR24IBD ARICULTIVATOR24IBD
GUMUZ20IBD GUMUZ20IBD
SUDANESE22IBD SUDANESE22IBD
SUDANESE24IBD SUDANESE24IBD
SUDANESE23IBD SUDANESE23IBD
AMHARA26IBD AMHARA26IBD
Using plink IBD >= 0.125 I am only left with 5 Hadza and 7 Blacksmith Ari. However, if I look at the admix chart in the study, I count 17 Blacksmith Ari and 16 Hadza, which is basically all of them. Despite what they have said in the Material and Methods section they did not actually perform this simple task.
DeleteBy the way, what's up with 'Omotic' in the Biaka, it doesn't make any sense.
ReplyDeleteYes, that is one of the major conundrums of this run I have been trying to reason with.
DeleteIf you notice in my previous run the Biaka and Mbuti pygmies had made completely independent clusters, then, with the addition of the Nilotic and Omotic samples, only the Mbuti Pygmies retained the cluster. However, if you look at the MDS plots (particularly C1-C2) that I posted earlier today you can see a clear distinction between Mbuti and Biaka Pygmies, the biaka pygmies seem less 'Hunter Gatherer' like and pull towards the remaining Africans on C2, hence when the Omotics were added into the mix and they occupy almost the same position on the vertical (C2) axis as the Biaka pygmies, the uniqueness of the Biaka Pygmies is blurred. So in the ADMIXTURE run, the biaka pygmies are composed in almost equal proportions of Omotic, Eastern Bantu and Pygmy with a bit of SAN, this kind of make sense in relation to where they are on the PCA plots. The Eastern Bantu cluster is also different from my V1 run too, I believe it has more indigenous rift valley and other ancient elements as it is wide spread throughout Africa.
So basically, right now I am inclined to think that Omotics may have some type of deep rooting HG ancestry with pygmies in Eastern Africa, the mbuti Pygmies became Isolated and Biaka pygmies picked up some other African elements, but perhaps the addition of other diverse samples in Africa may yet again change this....
By the way, I actually got the Biaka Pygmy cluster back and lost the Eastern Bantu cluster, I homogenized the Intra-African dataset using my studentization method, removed all samples that had studentize >2 for any cluster from the previous run, this took out 405 samples from across the dataset leaving me with 895 . The standard deviations also dropped across clusters and samples by >50%!.
DeleteThe interesting thing with this new run is that the East African2 cluster is so close to the North African cluster that the Egyptians are now almost exactly 50/50. East Africa2 also peaks almost simultaneously in the Afar and Somali, instead of just the Somali. The North Africa cluster peaks in Northwest Africa (with the Mozabites) at 89% and declines in North East Africa (Egypt) to about 50%, and in Northern Ethiopia to about 17%.
The other interesting thing also is that the Wolayta are 42.4% Omotic, which makes much more sense, and the results (at least at K10) look more similar to the publication than my first run did, last time (V1) my studentization method did not work so well and did not have an impact on the run, but this time it really did its job removing outliers and homogenizing populations, you can check out the full results here.
Results look more stable now, only thing that's still odd is 'East Africa 2', which looks like a small IBD-caused cluster.
Delete@Eze: "East Africa 2" or "East Africa 1"?
DeleteThe small cluster is EA1 actually (deep purple).
IMO EA2 (orange) is the product of ancient WEA-EAf admixture (based on what I have seen elsewhere, explained in a previous comment), so maybe EA1 exists "to compensate", so to say, as a still non-admixed/non-homogenized aboriginal affinity zone. In the end it's all a matter of affinity, not "true divisions".
Oops, meant to say 'East Africa 1'.
DeleteUpdated for K10 run with a newer outlier removed dataset.
ReplyDeleteInteresting new results. However, I think when you have clusters that are obviously Eurasian-influenced (East-Africa2 and North-Africa), it's important to use Eurasian references. That would make it more believable that they may actually represent real ancestral populations.
ReplyDeleteHave you had a look at Tishkoff?
ReplyDeletehttp://www.ncbi.nlm.nih.gov/pmc/articles/PMC2947357/
If you look at Figure 4 in this paper:
http://www.ncbi.nlm.nih.gov/pmc/articles/PMC2947357/figure/F4/
you can start to compare the components you are getting with the components generated in the Tishkoff paper. One of the important things that was done in that paper was that extensive Eurasian datasets were included.
The "components" that appear in Tishkoffs African populations are:
Niger-Kordofanian component
Nilo-Saharan component
Afroasiatic component
Ouldeme component (Cameroon)
Baka component
Khoesan/Mbuti component
Hadza component
Sandawe component
Dogon component (West Africa)
Fulani/Indian component
Middle East component
European component
Tishkoff didn't pick up an Omotic or Cushitic component because she didn't have enough samples from those populations. Your "East Africa 2" is probably a Cushitic component. However, to get a better idea, I agree with "Lank" that you need more samples from Eurasia.
With the exception of the the Cushitic and Omotic components appearing, your data appears to replicate the work of the Tishkoff paper. (A minor note is that due to her more extensive sampling, she's picked up more substructure in a few populations like the Dogon and Fulani, which don't appear in your runs.)
Appending this new data from Pagani to a global data set does not show much of a difference in African structure than without the addition of the Pagani dataset, even going all the way up to K14 . The Nilotic and Omotic components do not split as they do when looking at it from an African level, the one difference on a global level is that where as before (appending Pagani) the East African component used to peak in the Maasai, now the East African or rather best named Nilo-Omotic, peaks with the Gumuz and ARI-Blacksmith. Other than that, Ethiopians and other East African Afro Asiatics appear to be largely composed of this Nilo-omotic and a South West Asian Cluster (which likely itself is a hybrid of OOA +African Paleolithic and South West Asian Neolithic), with an additional bit of a cluster that peaks in North West African. The reason I can not observe much substructure in Africa on a global level, could potentially be due to a general Eurasian-Bias of the SNPs used .
ReplyDeleteWith respect to Tishkoff 2009, a more apples to apples comparison with this run would be to compare it with the intra African STRUCTURE run, (Figure S13 supplemental material) , although, this would still not be an apples to apples comparison with this run as Tishkoff used Autosomal Microsatellites instead of SNPs, nevertheless in that figure;
K2 – East and North Africans are differentiated from other Africans
K3 – Hadza split
K4 – Baka Pygmies split
K5 -Nilo Saharans split (interesting that Afroasiatics have some Nilo Saharan here)
K6 – North Africans split from AfroAsiatics
K7 – Mbuti Split
K8 – Sandawe Split
K9 – Fulani Split
K10 – Can't really tell from the Chart
K11- Looks like a cluster forms centered around east African Cushitics
Personally I think, that the East African1 cluster I keep getting has something to do with the Sandawe, but I can't prove it, yet.............
As I was looking at your latest runs last night, I also thought that East Africa 1 had a Sandawe association. The Sandawe do get there own component at low K values in Tishkoff's runs. However, in your runs, East Africa 1 appears at low level and is quite widely distributed, so it would be a stretch to infer a Sandawe association with your data set.
ReplyDeleteIt's true that the Pagani data set doesn't extend the evidence for African substructure outside Ethiopia. Regarding Ethiopia, the Pagani data set shows substructure within Afroasiatic samples - Omotic, Cushitic, Semitic, North African.
Regarding the "Omotic-Nilotic" component: Tishkoff notes that the Maasai are likely descended from both Nilotic and Afroasiatic groups. The archaelogical evidence strongly supports contact between Afroasiatic and Nilotic groups over the last 8,000 years. Therefore, although there is a long pattern of contact between these two groups, it it probably confusing to assign an Omotic-Nilotic component for the Maasai.
If you could get samples for the Songhai or other Nilo-Saharan groups who moved early into West Africa, you might be able to tease out evidence that Afroasiatic - Nilo-Saharan contact has occured within the last eight thousand years, and more likely within the last six thousand years.
There's some information on my blog about the separate but proximate economies of Afroasiatic and Nilo-Saharan speakers.
(www.linearpopulationmodel.blogspot.com)
I have to say that I think that you are doing a good job on this run. I've only recently started following your blog. I hope your next posts are as carefully constructed and well presented as this one.
Etyopis,
ReplyDeleteCould you try do some experiments with TreeMix on this new data? Perhaps you can find something interesting.
I had to unload R from my computer because it was using a conflicting library with that of the linear algebra library of the main computation software I use (Octave), in addition, due to the small size of memory I have on my machine, Treemix was not able to process the more voluminous global dataset I had, I therefore removed that as well. If you or anybody has Treemix and R loaded on your machine, I can prepare and upload the input files as well as the command line instructions I used in my previous Treemix analysis and you can run it on the new intra African dataset and see the differences (if there are any).
DeleteI'm currently traveling and kinda busy. I will look into it perhaps later on. Thanks for the info anyhow.
DeleteUpdated for different Eurasian proxy scenarios.....
ReplyDeleteMost interesting exercise, Etyopis. Thanks.
DeleteI'd say it is clear that there is a West Eurasian influence in North Africa and to lesser extent The Horn. But that this one is difficult to quantify using only one proxy, probably for reasons like:
· Various distinct sources of Eurasian backflow into Africa
· Locally important specificities vanishing in some cases (for example the "North Africa" component disappears in the Palestinian comparison but not the others, what may be critical in interpretation - you might want to do a K=11 instead of a K=10, in order to attempt to retain the K=10 Africa-only distinctions).
· Your call...
In North Africa at least the Japanese component is a regular fraction (c. 25%) of the French component in the respective panels. This correlation is not retained in East Africa (dropping to c. 13%) probably again because some key African component vanished in one but not the other (checked: no "East Africa" component in the French comparison).
You'd surely get a simpler comparison if using K=11 for the comparisons with Eurasians (but K=10 for Africa only).
In any case I think that it can be deduced that:
1. There is a clear West Eurasian flow into Northern Africa and The Horn. This is NOT generic ancestral (OoA) Eurasian affinity by some Africans because then the Japanese and French values would be similar and they are not even close.
2. This can be quantified (tentatively and roughly) using the French comparison in North Africa (so the North African component is not eclipsed). The result could be:
· Egypt (Delta): c. 56% [c. 60% in my own exercise with two distinct WEA comparisons]
· Libya: c. 46% [c. 45% in my exercise]
· Morocco-N: c. 36% [c. 30%]
· Morocco-S: c. 16% [c. 6%]
Another issue is that the North African component, by Fst looks as just another West Eurasian component and not just another African component. It should add but that's another story.
I do not dare to estimate the apportion of West Eurasian influx in the Horn because in one case the East African component and in the other the East African one are hidden by the "compaction" effect. In my December exercise I got very low values (4%, all Arabian) but the North African component was important prior to the coalescence at K=10 of an Ethiopian-specific component (with Fst signal of being homogenized ancient admixture) and this North African component is of WEA affinity (by Fst distances, very clearly).
But interesting anyhow in the sense that it really discards the OoA affinity hypothesis you suggested in previous discussions. It's really unlikely that something so old can be retained after bottlenecks and areal homogenizations (by means of normal "inbreeding" with your neighbors and drifting away from your geographically distant relatives).
“But interesting anyhow in the sense that it really discards the OoA affinity hypothesis you suggested in previous discussions.”
DeleteNot at all Maju, the problem with West Eurasians is that they have a distinct African Affinity on a global level as I have clearly demonstrated in my K2 Global run, they can not be assumed as a pure non-African proxy for Africans because they are already related with Africans, I.e they are not 'pure' from the start of the formation of the West Eurasian cluster @K3, this unwarranted notion of 'pure West Eurasians' is a residue of scientific racism that started a couple of hundred years ago, escalated during colonialism and later on found itself upheld in the Annals of Eugenics (now called the Annals of Human Genetics).
Now, I have acknowledged on several occasions that migrations into Africa after OOA have occurred in several instances (Paleolithic, Neolithic and Historical) according to uni-parental markers (mtDNA U, H, N … YDNA J,R... and so-forth), however these migrations did not occur in a unidirectional manner, but rather bi-directional (YDNA E1b1b, Helicobacter pylori, Li & Durbin ….).
Therefore, I still hold the opinion that these components are best viewed as being composed of layers of different events of human migrations, the primary one or the foundation of them all being Out of Africa.
Your K=2 global run only detects East Asians and some very diverged "Paleo-Africans" (not really liking this word but I can't think of any better). All the rest appear as an hybrid artifact that is, in my opinion, meaningless. What Admixture says, very specially for the 50-50 populations, is "neither this nor that" - nothing else.
DeleteSo with Europeans it says: "not really East Asians but 75% chance of being East Asians and 25% of being African", and so on with the other populations.
"Therefore, I still hold the opinion that these components are best viewed as being composed of layers of different events of human migrations, the primary one or the foundation of them all being Out of Africa."
Not at all: autosomal genetic clusters are generated by inbreeding, this can be intense and recent or extense and ancient but only looking at the clusters you'll never discern one and the other. You need a multidimensional apporach looking at every angle (in autosomal data: diversity, Fst distances between components, etc. - but also to haploid data, which is most informative on its own right).
Based on haploid DNA the primary division should be Khoisan and the rest, then Pygmy (and maybe some neighbors) and the rest, then West Africans and the Rest and only then Eurasians vs Africans. But that is not what you get when you apply Admixture because Admixture is not that smart after all and samples and other issues (like re-homogenization of ancient admixture... or recent intensive cousin marriage) also matter.
There is indeed a small amount of African admixture in West Eurasians (and not East Asians) but (1) this one varies clinally (so you may want to use Scandinavians instead of Palestinians as proxy if you are concerned by that) and (2) it is small enough not to show up in most autosomal runs. It's something rather subtle, more obvious in haploid genetics in fact.
In any case if these apparent levels of (West) Eurasian back-flow would be (in any large fraction) just significant of c. 100,000 years old ancestral affinity, we'd see that the French and Japanese bars would be identical or almost, instead it totally looks like the Japanese bar is nothing but a low quality for generic Eurasian backflow (i.e. a pale shadow of the real WEA backflow).
I don't think you can detect autosomal affinity from that old between separated groups. For one simple reason: it is not discernible from generic human (H. sapiens) affinity. Based on haploid genetics, even Pygmies had surely not diverged much from the main population in East and Central Africa when the OoA happened, only Southern African Aboriginals (Khoisan) were probably distant enough to be noticeable but (1) later admixture would have smoothed that difference and (2) I'm not sure how we could design the relevant exercise.
But in any case just my opinion.
You can't have your cake and eat it too. The fact of the matter is that @ K=2 before the formation of the West Eurasian cluster, West Eurasians appear to be composites of a non-African and African component, then at K=3 they start belonging completely to a West Eurasian component, this component also happens to be intermediate between the East Asian and African components in terms of Fst, albeit slightly closer to the East Asian component.
DeleteBTW, it was not only my run that shows a significant African component in West Eurasians at K=2 but also the STRUCTURE run of Behar (2010), matter of fact at K=2 in that run, West Eurasians belong almost completely to the African cluster, but in my humble opinion, the dataset I used has more global populations sampled including more Eurasians and Africans and is more accurate (though it has less SNPs).
So like I said you can't have your cake and eat it too, if you want to use the West Eurasian signal generated from model-based algorithms as the source of non-African input in Africans, then you must also admit that the same West-Eurasian signal is formed from a synthesis of African and non-African inputs.
I've always argued that such a misunderstanding of cluster analysis is useless and misleading. And that is why you in other cases apply that method, whose name I do not recall, to hint at which number of clusters is optimal, i.e. the most realistic representation of the analyzed samples. Typically is >10 (13 or so?) for a global sample. That is the real analysis.
DeleteWhat do you think it would happen if we compare birds, mammals and lizards at K=2? That one of the three clusters would show up as intermediate (not sure which, depends on sample sizes and such), same with global population analysis.
It's not "my" cake, it's "the" cake in any case.
"this component also happens to be intermediate between the East Asian and African components in terms of Fst, albeit slightly closer to the East Asian component".
Haven't checked intensively but that is exactly my point: the "normal" OoA Fst distance is c. 0.200, while major (East-West) intra-Eurasian distances are of the order of c. 0.150 and intra-West-Eurasian Fst values are between 0.060 and 0.110 (say an average of 0.85).
IMO these distances represent roughly the successive divisions:
1. c. 0.200 around Out of Africa time (c. 130-80 Ka ago)
2. c. 0.150 around "Eurasian Expansion" time (c. 80-55 Ka. ago)
3. c. 0.085 around Western Eurasian colonization time (c. 55-30 Ka ago)
This should be much more accurate than your K-estimates, which are the wrong way of looking at the problem.
[The main exception is when it totally looks like a component is product of homogenization after ancient admixture, as can happen when an Ethiopian or Fulani specific component coalesces (depending on samples and K level), eclipsing an African and Eurasian component by Fst values, with Fst values that are intermediate. In this case I think the best explanation is ancient homogenized admixture - unless you can suggest a better one - but in any case is a very localized interpretation problem].
"the STRUCTURE run of Behar (2010), matter of fact at K=2 in that run, West Eurasians belong almost completely to the African cluster"
Actually it is vice versa (and not 'almost' but 'totally'): Africans are undersampled and absorbed in the West Eurasian cluster. That's why there is no cline (because no African is closer to East Asians than to West Eurasians, while the opposite is true). Just that, confusingly the cluster is painted in brown (it should be blue but whatever).
Check it all you want, Behar's "brown" K=2 cluster splits in two (brown and blue) at K=3 with no "border change". Your blue (African) cluster does not split in two like that: they represent different things: yours is really an African component (because your African sample is large), while Behar's is a West Eurasian one (and undersampled Africans are forced into it 100%).
In other words K=2 is not good enough and will vary a lot depending on sampling strategies (try undersampling East Asians for example). Actually K=3 etc. are not very informative either (we need K>10, probably K>13 to be in the safe zone) but K=2 is ridiculously confusing to the extreme.
"the same West-Eurasian signal is formed from a synthesis of African and non-African inputs".
Apparently not, because even with undersampled West Eurasians (your latest trial with just a few French, for example), West Eurasians appear neatly distinct, just like Pygmies or Khoisan. Also the Fst distance to Africans is invariably very high, in the OoA levels (Fst>0.180 zone I mention above). It must be somewhat diluted but it is at very low levels, nothing too obvious.
Minor-moderate Western Eurasian gene-flow into the Horn of Africa is evident and from the looks of it ADMIXTURE k=10 (Africa V2b + French) seems to be the most informative. We can logically assume that the French cluster acts as a reliable proxy for legitimate West Eurasian ancestry in North Africa/NE Africa regardless of the probability that the French cluster itself contains traces of ancient African gene-flow. Nevertheless the North African cluster seems to act as a signature for complex bidirectional Afro-Eurasian gene-flow, either be it in North Africa, NE Africa, or Western Eurasia.
ReplyDeleteThe Japanese run is also very interesting, although the North African cluster in this case is much more African than in previous runs; likely indicating the exclusivity of the Japanese cluster in comparison to the French in terms of "Eurasianess".
I personally think it's safe to assume that Highlander NE Africans, i.e. groups like the Tigray, Amhara, and Beta Israel, are approximately around ~30% Western Eurasian, in contrast to lowlanders at about ~15% Eurasian. In addition, coastal North Africans like the Mozabite seem to be somewhere around 1/3rd African. This would mirror the results documented in Tishkoff et al. 2009 and imho seems to be the most probable and realistic scenario.
"We can logically assume that the French cluster acts as a reliable proxy for legitimate West Eurasian ancestry in North Africa/NE Africa regardless of the probability that the French cluster itself contains traces of ancient African gene-flow."
DeleteWhat kind of 'logic' is that? Paradoxical logic? LOL!
And by the way, the French had more than 'Traces of African Gene-flow' in my K2 global Analysis at 29% African.
DeleteYour K2 analysis is pointless. It would be useful ONLY if you'd measured admixture between two well defined groups, anything else it's just effect of forcing third, fourth, fifth, etc. groups into an A or B false dichotomy.
DeleteIncidentally I was thinking of you when I discussed recently Khoisan autosomal genetics (on Pickrell 2012, open access).
Why? Parltly because you have been stubbornly adamant of misreading the usual L-shaped global PCA (with the usual sampling strategy), a misreading that is essentially the same you are doing here with your K=2 discourse. But all that, I insist, depends on sampling strategies largely, so for Behar 2010 Europeans did not appear as intermediate of Africans and East Asians but as their own pole, in which (undersampled) Africans were subsumed by default. Pickrell offers us another different viewing angle with his oversampling of Khoisan and generally African peoples and using Eurasians (both West and East Eurasians) as control.
Pickrell's global PCA (legend) makes an L-shape but, unlike the graphs we are most used to, the angle of the L is not in Europe or West Asia at all but in the non-Khoisan Africans pole, while Eurasians do cluster together (with Europeans slightly "more African" than East Asians, yes but just a bit).
Because of the oversampling of Khoisan and other Africans, this is IMO actually a more reflective analysis of the overall Human structure, which is essentially African, with an Eurasian-plus offshoot.
Pickrell also has a an Admixture analysis, in whose K=2 level French (the only non-African sample in this case) make up one component and the other corresponds to the Ju|'hoan. But that is trivial and I mention only as counterpoint, because K=5 is, among those levels studied, the one probably more reflective of reality.
Of course greater depths should give an improved understanding, because Humanking or just the African part of Humankind cannot be described as admixture of any two simple components but as a large array of various populations (and subpopulations) firstly differentiated by means of millenary isolation (relative inbreeding or endogamy) and only secondarily, in some cases at least, admixed with each other. You cannot describe 13 or 28 components with just two simple shades of color: no way!
Maju, instead of attacking my sampling strategies why don't you propose what the correct number of samples and geographical allocations should be for a global Analysis? After all, there are only a finite number of people/groups of people in the world. And then, you could simply perform a K2 analysis on that and we could compare notes.
DeleteDon't take it personally, I beg you, but you are in clear error in some interpretations which are forced and not well done.
DeleteIn any case it's not your sampling strategy: your sampling strategy is fine, as long as you acknowledge it is one among many possible and don't over-read or misread some of the analysis. One analysis will only give you one viewpoint and we need many different viewpoints to understand even a bit the multidimensionality of actual human population genetics.
We can't get a phylogeny out of autosomal DNA: we get very rough approximates at best or totally distorted results at worst... because the "real tree" is not any tree but an irregularly dense hyper-web. The tree model assumes just divisions and not mergers and that can only happen with simplified genealogies like purely paternal (Y-DNA) or purely maternal (mtDNA) ones.
"After all, there are only a finite number of people/groups of people in the world".
Seven billion individuals in the extreme, 7000 language-defined ethnicities or some 40,000 dialect defined populations, some 250 polities, tens of thousands of provinces or regions, etc...
And each group is imprecisely related with the rest. The number may be finite but it's certainly not two.
The method of optimizing the number of clusters in an Admixture analysis, you know well (cross-validation), better than me. You know that the cross-validation value seldom legitimizes less than a dozen clusters for any sizable and distinct number of samples. Anything less than a low cross-validation value is useless in any case, because it's forcing third categories into false dichotomies. It's like demanding the color blue to split between green and red: the result is identical to that of grey between black and white but it's a false result; it's like forcing the direction up to be defined in terms of left or right, etc.
"And then, you could simply perform a K2 analysis on that and we could compare notes".
You can't use K=2 as meaningful unless you are actually comparing two basic groups and intermediates, for example HGDP samples YRI (Nigerians), CEU (Utah Whites) and ASW (African Americans), in which these last can effectively be described as a linear admixture of the other two (or very similar ancestral populations). But I have just mentioned two different examples of global K=2 analysis that are not coincident with your K=2 analysis or among them: just because samples are different everything changes.
There is no simple duality in Humankind: there is a branching and seeding of populations like (simplified): (1) proto-Khoisan, (2) proto-Pygmy, (3) proto-West Africans, (4) proto-Eurasians, etc., including their (often disparagingly diverse) subgroups. But then there is interaction among them or lack of it... re-homogeneization (partial neutralization of the process of divergence) or increased drift (simplest process) - or even both. That can't be read in a K=2 graph. At best it gives a very blurry impression.
You have been doing a great job analyzing African and other human genetics but in this you are radically wrong: misusing the instruments of analysis much as an illiterate could read "crossroads" in the letter X.
“as long as you acknowledge it is one among many possible and don't over-read or misread some of the analysis”
DeleteThat is the thing right there, I do not think it is one among many possible results, when you divide the world into 2 genetic poles, you will always get 1 result, and that is Africans on one side of the pole and East Asians/Amerinds on the other side of the Pole, I agree that the corresponding compositions you would get for the populations in between would vary depending on sampling, but I also believe that the dataset I used has more of the 'in between' populations than what is currently out there and is thus the most accurate, there may off-course be variations on the results depending on the SNPs used as well, but I am fairly convinced that it is fairly accurate. One way you can check is by measuring the clinal differentials, a well represented dataset should have the least Average clinal differential @ K=2.
“The number may be finite but it's certainly not two.”
Yes, but the minimum you could divide it is into two, everything else proceeds from there.
“Anything less than a low cross-validation value is useless in any case,”
The cross validated result is the optimized (K-optimum) final result where the maximum likelihood plateaus for a given dataset, that does not mean that the results generated for K< K-optimum are meaningless, the final result is a direct consequence of the previous K values. For example, give me a random genome typed for those same SNPs that I used in my global analysis and @ K=2 I would be able to tell you if he/she falls into the African, EastAsian/Amerind or intermediate between the two clusters, @ K=3 I would tell you if he/she falls in the West Asian, East Asian, African or clusters intermediate thereof, and so forth for 4>=K<=optimum, but the fundamental genetic split of humanity is at K=2, that is the BASIS and it is by no means meaningless.
“There is no simple duality in Humankind”
I respectfully disagree in terms of genetics here Maju.
"when you divide the world into 2 genetic poles, you will always get 1 result, and that is Africans on one side of the pole and East Asians/Amerinds on the other side of the Pole"...
DeleteThat is not what Behar 2010 (where Africans are relatively undersampled) gets: he gets a West Eurasian and an East Asian pole at K=2. The African pole only shows up at K=3. But as Africans are invariably closer to West Eurasians (if nothing else because West Eurasians have minor, often subtle, African admixture all around), Africans appear as wholly in the Eurasian cluster.
The behavior is extremely different to your own K=2 experiment.
I must say that, back in the 1990s, even someone of the height of Cavalli-Sforza misinterpreted similar results to your own the way you did: he did suggest in some works that Europeans or West Eurasians would be a mixture of 2/3 Asian blood and 1/3 African blood but that's not really true and nobody after him or even himself later on have reclaimed such result. It is a simplistic misinterpretation. I always wondered how could he arrive to such conclusions but reading you, I now understand how, and which was his error.
"Yes, but the minimum you could divide it is into two"...
That's an arbitrary division. It's like dividing people in Ireland between blonds vs redheads, or blonds vs brunettes, or redheads vs brunettes... something is lacking all the time. It's like dividing the realm of life between plants and animals and then saying that sponges or bacteria or viruses are something in between. You can only divide a reality in two if all (or at least most) cases (samples) cluster in two clearly defined zones and that is often not the case.
For example when you compare European subpopulations and a Nigerian control, there is always a simple dichotomy (although the second dimension may stretch ones or the others, depending on relative internal genetic diversity of each sample contrasted with the Nigerian control). That's easy. But when you get Moroccans in the equation it becomes more complicated because even if Moroccans may have some European or West African genetic influences, they also have their own unique elements, that get them out of the dichotomy if you allow for that to happen. (See here for actual graphs illustrating these examples).
(cont.)
(...)
Delete"The cross validated result is the optimized (K-optimum) final result where the maximum likelihood plateaus for a given dataset, that does not mean that the results generated for K< K-optimum are meaningless"...
They can be really close to meaningless and they certainly do not automatically mark the first branching in the "tree of Humankind". The higher the cross-validation value, the more distant from the optimum, the more irrelevant and confusing it is.
"... but the fundamental genetic split of humanity is at K=2, that is the BASIS and it is by no means meaningless".
You only get two poles, which are rather determined by the sampling strategy: oversampled real clusters such as (typically) East Asians, West Eurasians, West Africans... tend organize the rest. However genetic difference also weights and so even relatively under-represented real clusters like may be Pygmies or Khoisan in some cases, also produce polarities. I can't really explain how that happens because, as you know, maths are not my strong point - but I know from experience that it happens that way.
But when extremely undersampled, even very distinct populations like Khoisans (we used to see them in very low numbers until recently), may appear as (false) "admixture" of other clusters.
Whatever the case, those poles have been determined, all the rest is forcibly aligned with them depending on whom they resemble more gene by gene. There's no "grey component" indicating which genes or AIMs could not be aligned (it'd be a good idea however), otherwise you'd see in your K=2 (and all other K=2 graphs) how most of the samples would be essentially "grey" (= neither this nor that).
It's a true pity that no Admixture-like program or variant showing what is not aligned with any of the components exists. It would be of great help.
Cheers.
“That is not what Behar 2010 (where Africans are relatively undersampled) gets: he gets a West Eurasian and an East Asian pole at K=2. The African pole only shows up at K=3.”
DeleteThis is actually not true at all, since I have the behar samples as a subset of my dataset I had also attempted running ADMIXTURE on just the Behar Subset, and clearly one of the K2 poles is African and NOT West Eurasian, hence why they painted the cluster brown, I.e same colour as the African cluster in K3, in my simulation, I get approximately what Behar gets, for example the French were 77.6% African in my run, where as in Behar '10 the French get ~95% African, similarly in my run the Russians get 69.8% African, where as in Behar '10 the Russians get ~80% African. I attribute the slight differences to 2 things, (1) The volume of SNPs used and (2) The Software used; Behar used STRUCTURE, I used ADMIXTURE.
“Africans appear as wholly in the Eurasian cluster.”
You obviously have it the other way around...
“You only get two poles, which are rather determined by the sampling strategy: oversampled real clusters such as (typically) East Asians, West Eurasians, West Africans... tend organize the rest.”
You are doing too much speculation with very little validation/experimentation, for example take the 3 poles that appear in a K3 global run and then run K2 on that particular dataset, what do you get? In-fact, I did this for 220 West Africans, 375 Europeans and 503 East Asians, guess what I got, the French were 64% African and 36% East Asian. So the poles never change, cluster distribution for in-between populations may change depending on the quantity and diversity of the in-between populations sampled, if I included more Africans in the Above run then the French would have less African and more East Asian, if I include more South Asians (who are related to aborigines) then It would change again, adding more middle easterners would also yet again change the results, but the poles NEVER change.
I'll get to you later, when I do some experimental exercise but for sure that the poles do change depending on samples and so on. Just try with 200 Africans, 10 Europeans and 10 Japanese... or with 200 Eurasians and 10 Africans... or...
DeleteEtyopsis, is there anyway you can upload your merged dataset used for this run, so that i can try it with experiments on my own, for new worlders = ) This would be great, this is Lemba.
ReplyDeleteI have uploaded the file under Africa Dataset (V2) on the Public Datasets/Resources page.
DeleteHi. Im still just trying to understand my results..Im new to the DNA side of genealogy. My mom is mostly black with a small 15% white, and my dad is a European mix (all white)...
ReplyDeleteHere are my results:
Kit Number: F372029 Iteration: 206 Delta-Q: 5.714213e-08 Elapsed Time: 8.75 seconds
Population Chr--> 1 2 3 4 5 6 7 8 9 10 11 12 13 14 15 16 17 18 19 20 21 22
Nilo-Saharan 7.8% 17.7% 4.4% 7.2% 5.1% - 10.6% 1.6% 10.0% - 6.7% 0.4% 4.9% 18.5% - 2.2% 18.5% 4.0% - - 4.2% -
North-Africa 3.2% 16.7% 6.7% 5.6% 8.0% 14.7% 11.0% 16.1% 5.8% 14.7% 17.2% 15.2% 15.5% 22.6% 25.9% 23.4% 33.5% 27.0% - 15.7% 5.4% -
Mbuti-Pygmy - - - 2.7% - - - - - 0.3% - 1.3% - - - - - - 5.4% 0.4% 1.5% -
Eastern-Bantu 15.5% 1.3% 11.9% 13.2% 8.2% - 7.9% 23.4% 8.1% 11.6% 16.7% 14.4% 7.1% - 21.0% 21.4% 2.4% 21.9% - 11.5% 13.1% 22.4%
Khoi-San - - - - - 3.5% 3.1% 1.8% - - - 0.1% - - - - 4.6% 0.7% - 8.2% - 0.8%
West-Africa 13.1% 20.9% 30.0% 17.4% 24.5% 27.1% 26.6% 16.2% 26.4% 26.7% 16.0% 15.6% 8.3% 11.8% 5.8% 17.2% 16.7% 16.3% 20.6% 9.0% - 8.5%
Hadza - - - - 2.9% 6.1% 3.0% 2.8% - 4.2% 1.8% 3.8% 2.5% 0.5% - 3.6% - 2.1% - 4.6% - 8.7%
Biaka-Pygmy - - - 0.5% - - - - 3.4% 3.3% - 11.5% 12.2% 10.5% 3.8% 1.2% - - - 2.4% - -
French 47.9% 39.3% 47.0% 53.4% 46.9% 36.2% 37.8% 38.1% 46.3% 39.2% 41.6% 37.6% 49.0% 36.1% 28.7% 31.0% 24.3% 28.0% 74.0% 48.2% 75.8% 59.7%
Omotic 12.4% 4.1% - - 4.4% 12.4% - - - - - 0.1% 0.6% - 14.9% - - - - - - -
Number of SNPs eval: 1977 2305 1846 1777 1717 1684 1355 1586 1302 1398 1248 1317 1157 883 780 811 552 846 269 620 423 276
I was also perplex at first because the "French" results score are in most cases well under 50% (and should be >50%). But if you add to the "French" the "North African" affinity component (which is also West Eurasian, as the Tropical African affinity in real North Africans would be reflected in other categories), then you have reasonable results in this aspect (or so it seems to me): all "white" scores are above 50%, as should be. The "North African" affinity can indicate a degree of Mediterranean ancestry, as in Greek, Italian or Iberian (or West Asian too).
DeleteNotice that for earlier generations a random element is at play: you inherit one chromosome from your mother and one from your father but each of these are random remixes of your grandparents, etc. (recombination), so the "white" ancestry inherited from your mother can vary: in one chromosome it can be 0% and in another 90% (I'm actually spotting that figure in chr. 21).
As for the African side, it seems quite mixed but not sure how informative are these categories anyhow. For whatever is worth, my impression is that the Eastern African components are quite heavy, suggesting a maybe Mozambican-dominated ancestry. But compare with other Afro-descendants for safety (after due pondering).
Hope this helps.
Sorry to be a plonker!!! BUT when I run dna through your tool - they come up pretty equal without differentiation. My Mother i law should show up some African (or possibly Caribbean) if the family story and some old photos are to be believed. On the European (French) - African tool she shows 15% African and pretty much the rest European. BUT me and my Father i law come up pretty similar - which we shouldn't do. Am I using/interpreting this incorrectly?
ReplyDeleteWould my phased data or unphased data be more accurate. My daughter phased her kit so her maternal kit which is me is about 7 percent more african than my unphased it. which one would be more accurate
ReplyDeleteI used the plus french
ReplyDeleteHello, DNA testing revealed that I was 74% Sub -Saharan West African, 1.7% East Asian/Native American, 18% European, 0.2% Middle Eastern/North African. EhioHelix k10 + Palestinian run shows an 89.89% Palestinian percentage. What does this mean? I am inexperienced with this. Your help is appreciated.
ReplyDeleteThank You
Can you explain my numbers to me please?
ReplyDeleteThank you.
Can you add a calculator to filter the native american imput out? its confusing as I dont know where my native goes. thank you.
ReplyDeleteI'm Northern Ethiopian (Habesha). 23&me shows I have 3% Middle East/North African in me and remainder East African. Is it more accurate to use the African Only calculator or +Palestinian?
ReplyDeleteWhat is:
ReplyDeleteEast-Africa 2 and East-Africa 1?
Why are Egyptians classified as French or predominantly French of the the reference population chart? Is it because they are genetically more similar to Palestinians than they are to Algerians?
ReplyDeleteThis comment has been removed by the author.
ReplyDeleteI am 98-99% Ashkenazic Jewish ( based on MyHeritage and FTDNA analysis) with a smattering of Finn/Central Asian genetic material. I ran my kit through Gematch on your Ethio-Helix+Palestinian, and I find this breakdown: Biaka-Pygmy 1.99 Pct; Palestinian 88.25 Pct; Omotic 8.38 Pct, and a smattering of others. Since Ashkenazic Jews and Palestinian Arabs share a large amount of ancestral DNA, would this result be consistent with that finding?
ReplyDeleteUNDER DEVELOPMENT: