Note, I wrote a small script that can enable sorting of the relative frequencies by clicking the haplogroups, you can find the script
Showing posts with label Haplogroups. Show all posts
Showing posts with label Haplogroups. Show all posts
Tuesday, June 16, 2015
Sudan MTDNA
Find below relative frequencies for Sudanese MTDNA from a thesis entitled "Genetic Patterns of Y-chromosome and Mitochondrial DNA Variation, with Implications to the Peopling of the Sudan", the entire thesis can be downloaded from here. The thesis also includes YDNA data, but those same results have been already covered in this blog post. Additionally, some interesting ancient YDNA data is also included in the thesis.
Note, I wrote a small script that can enable sorting of the relative frequencies by clicking the haplogroups, you can find the script@ JSFiddle, if you find the script useful and would like to use it for other relative frequency charts, please cite the JSFiddle link from above.
Note, I wrote a small script that can enable sorting of the relative frequencies by clicking the haplogroups, you can find the script
Saturday, June 6, 2015
More Ethiopian Uniparental Data (More resolution.. less clarity)
A new paper attempting to decipher the out of Africa exit route by focusing on Ethiopian and Egyptian autosomal genetics was published a couple of weeks ago. Putting aside the 'hocus pocus' autosomal analysis for a moment, I was quite intrigued by the more concrete uniparental relative frequency images published in the supplemental material, not a lot of clarity is attached with these images however as the actual numbers are not given.

Note that the phylogeny they reference for the results here, is from Phylotree Y.
Below I have attempted to interpret some of the colors from the image into Numerical approximations, note these are only approximations and not a substitute for the real data, of which I am not privy to.
A-M13 :
The prevalence of this haplogroup in Ethiopia has always been known to us, however the extremely high frequency in the Wolayta is quite a surprise, this could be due to the relatively small sample size however, as the much higher sample size of the Wolayta found in the Plaster thesis, only showed 13% of A-M13.
B-M150 and B-M8495 :
Only found in the Gumuz, we have known for a while that B is not prevalent at all in the wider Ethiopian population, rather it is a continuation of the much larger B frequencies found in Niloitic Sudan. Still, it is good to see a finer resolution of B, and that the majority of B clades in Ethiopia belong to the small B-M8495 branch.
E-M96:
This could potentially be a wide variety of things, but my money would be on E-M329, sister clade to E-M2 and child clade of E-V38, which in turn is a sister clade to E-M215, the most prevalent YDNA lineage in Ethiopia.
E-M215
As this is showing only in Northern Ethiopia, I would think it maybe E-V92, it still could however be a basal "E3b" lineage.
E-V22
A variant of E-M78, this lineage has always been found in low amounts in Ethiopia, with moderate amounts in Sudan and Egypt.
E-Z1902
This is a lineage that is found downstream of E-M78, but unites E-V12 with E-V65, which means the results would include E-V32 , a sublineage of E-V12 and the most frequent YDNA lineage in Somalis, I would wager that all of the E-Z1902 is actually E-V32, since E-V65 has never been found in Ethiopia thus far. There is a chance that some E-V12* could be in the mix as well.
E-Z830
This lineage has been discussed before, it unites many lineages in Ethiopia, including E-M34,E-M293 and E-V42. It looks like they did not test for E-V42 from the image however, so it could be E-V42.
E-M34
The prevalence of this lineage in southern Ethiopia from the image above, could be further confirmation of the high frequency of E-M34 found in the omotic speaking Maale from the plaster thesis.
EM4145
This is a tricky one, I am not sure what it is , I have searched for SNPs named as such and came back empty handed, to complicate things further, it is shaded a similar color as E-M293, but I discounted that lineage based on the fact that the lineage they report here is found in relatively high frequency in Ethiopia, whereas previous data shows that E-M293 is only found in low to moderate frequencies in Ethiopia. My best guess for this SNP would be something equivalent to E-V6, if not that then E-P2(x E-M215), but with less confidence for the latter, as if that was the case, I would think they would have given it a more basal presence in the hierarchy of YDNA lineages from the image above.
J and T
These F belonging lineages look both to be inline with what we already know in terms of frequency distribution throughout Ethiopia.
refs:
http://ethiohelix.blogspot.com/2010_12_01_archive.html
http://ethiohelix.blogspot.com/2012/01/e1b1b-update.html
http://ethiohelix.blogspot.com/2012/11/extensive-doctoral-thesis-on-ethiopian.html
http://ethiohelix.blogspot.com/2013/05/another-extensive-thesis-on-east.html
Update 06/07/2015 - MTDNA


Note that the phylogeny they reference for the results here, is from Phylotree Y.
Below I have attempted to interpret some of the colors from the image into Numerical approximations, note these are only approximations and not a substitute for the real data, of which I am not privy to.
| Amhara | Eth Somali | Gumuz | Oromo | Wolayta | |
|---|---|---|---|---|---|
| A-M13 | 27% | 0% | 55% | 19% | 48% |
| B-M150 | 0% | 0% | 4% | 0% | 0% |
| B-M8495 | 0% | 0% | 35% | 0% | 0% |
| E-M96 | 3% | 4% | 0% | 6% | 12% |
| E-M215 | 3% | 0% | 0% | 0% | 0% |
| E-V22 | 9% | 0% | 0% | 5% | 3% |
| E-Z1902 | 8% | 80% | 4% | 20% | 0% |
| E-Z830 | 0% | 0% | 0% | 0% | 3% |
| E-M34 | 3% | 0% | 0% | 5% | 13% |
| EM4145 | 17% | 0% | 0% | 25% | 20% |
| J | 25% | 11% | 0% | 19% | 0% |
| T | 3% | 4% | 0% | 0% | 0% |
A-M13 :
The prevalence of this haplogroup in Ethiopia has always been known to us, however the extremely high frequency in the Wolayta is quite a surprise, this could be due to the relatively small sample size however, as the much higher sample size of the Wolayta found in the Plaster thesis, only showed 13% of A-M13.
B-M150 and B-M8495 :
Only found in the Gumuz, we have known for a while that B is not prevalent at all in the wider Ethiopian population, rather it is a continuation of the much larger B frequencies found in Niloitic Sudan. Still, it is good to see a finer resolution of B, and that the majority of B clades in Ethiopia belong to the small B-M8495 branch.
E-M96:
This could potentially be a wide variety of things, but my money would be on E-M329, sister clade to E-M2 and child clade of E-V38, which in turn is a sister clade to E-M215, the most prevalent YDNA lineage in Ethiopia.
E-M215
As this is showing only in Northern Ethiopia, I would think it maybe E-V92, it still could however be a basal "E3b" lineage.
E-V22
A variant of E-M78, this lineage has always been found in low amounts in Ethiopia, with moderate amounts in Sudan and Egypt.
E-Z1902
This is a lineage that is found downstream of E-M78, but unites E-V12 with E-V65, which means the results would include E-V32 , a sublineage of E-V12 and the most frequent YDNA lineage in Somalis, I would wager that all of the E-Z1902 is actually E-V32, since E-V65 has never been found in Ethiopia thus far. There is a chance that some E-V12* could be in the mix as well.
E-Z830
This lineage has been discussed before, it unites many lineages in Ethiopia, including E-M34,E-M293 and E-V42. It looks like they did not test for E-V42 from the image however, so it could be E-V42.
E-M34
The prevalence of this lineage in southern Ethiopia from the image above, could be further confirmation of the high frequency of E-M34 found in the omotic speaking Maale from the plaster thesis.
EM4145
This is a tricky one, I am not sure what it is , I have searched for SNPs named as such and came back empty handed, to complicate things further, it is shaded a similar color as E-M293, but I discounted that lineage based on the fact that the lineage they report here is found in relatively high frequency in Ethiopia, whereas previous data shows that E-M293 is only found in low to moderate frequencies in Ethiopia. My best guess for this SNP would be something equivalent to E-V6, if not that then E-P2(x E-M215), but with less confidence for the latter, as if that was the case, I would think they would have given it a more basal presence in the hierarchy of YDNA lineages from the image above.
J and T
These F belonging lineages look both to be inline with what we already know in terms of frequency distribution throughout Ethiopia.
refs:
http://ethiohelix.blogspot.com/2010_12_01_archive.html
http://ethiohelix.blogspot.com/2012/01/e1b1b-update.html
http://ethiohelix.blogspot.com/2012/11/extensive-doctoral-thesis-on-ethiopian.html
http://ethiohelix.blogspot.com/2013/05/another-extensive-thesis-on-east.html
Update 06/07/2015 - MTDNA

Tuesday, October 8, 2013
TMRCA calculator for Python
I have converted the TMRCA calculator to run from only on Octave to Python as well, see here for the Octave version.
It is specifically made for Python 2.7, and have not had a chance to test it on other versions. No more libraries are required to run the script other than the standard libraries that come with 2.7. Some of the advantages of converting to Python are: less steps to run the program, easier for (future) web app deployment and more user access to Python than Octave.
The Zip file can be dowloaded here: https://dl.dropboxusercontent.com/u/42082352/TMRCA.zip
--------------------------------------------------------------------------------------------------------
TMRCA Calculator Instructions - for python 2.7
To check if the TMRCA program is correctly working on your system, first run it with the dataset
provided here before trying different datasets, to do so:
(1) Make sure you have python 2.7 loaded on your system (either Windows or Linux will work) and start running the interpreter.
(2) In the interpreter, change your working directory to the directory where you saved the unzipped folder by using:
(i) import os
(ii) os.chdir('~PATH/TMRCA/')
-Where ~PATH is the full path where the TMRCA folder is placed on your system.
If you are unsure of your current working directory, type the command: os.getcwd()
(3) import the tmrca module by typing: import tmrca
(4) Execute Script by typing: tmrca.Analysis('EM35_Example.csv','all')
(5) If this produces results with no errors in the interpreter, then the program is correctly installed and you can proceed to reading and analysing different datasets.
Reading and analysing new Data
After correctly executing the above steps, read and analyse new data by using the following steps:
(1)Examine the example STR data file in the "TMRCA/" folder entitled "EM35_Example.csv"
(2)Any STR data file to be analysed should first be made in the same format as the "EM35_Example.csv" file , specifically:
(a) DYS names in the first row should have the exact same nomenclature (the orders can be different however).
(b) Each row (except the first) should represent one sample.
(c) Each coloumn (except the first) should represent repeats for one marker/DYS#.
(d) The first column should represent sample identifiers, ex. Kit#, sample ID,...
(e) The cell found in the first row and first column should have the Dataset's name, this will be the same name used throughout the analysis.
(f) No cells shall contain null values and avoid having cells that contain characters which have spaces in between them.
(g) The file MUST be a *.csv file with commas used for field delimiters
(3) Place the *.csv file directly in the "TMRCA/" folder (i.e. in your working directory)
(4) Start the interpreter, change the working directory to '~PATH/TMRCA/', as per the instructions above and import tmrca.
(5) If you want to analyse a specific set of markers from your dataset go to step 6, otherwise go to step 7
(6) Go to the file "/TMRCA/Markerlist/49markerlist.txt", and pick the markers you want to use for analysis from there. Save your chosen
markers into a new *.txt file and into the same folder as "/TMRCA/Markerlist/". Take a look at any of the other marker list text files in
the folder for an example of how a marker list should look. Note that all marker list files need to be *.txt
(7) If you are specifying a set of markers to use for the analysis, for example "8_Chiaronimarkerlist.txt", then run the program
by typing: tmrca.Analysis('EM35_Example.csv','8_Chiaronimarkerlist.txt'),otherwise, just type: tmrca.Analysis('EM35_Example.csv','all').
Sunday, April 21, 2013
Source code for the ASD based TMRCA calculator (Octave)
The code for the TMRCA calculator of YDNA STR haplotypes that I use can be downloaded from here : https://dl.dropboxusercontent.com/u/42082352/TMRCA_ASD.zip
See also here for instances of where I have used the calculator in the past:
http://ethiohelix.blogspot.com/2012/06/finding-tmrca-of-ethiopian-ydna.html
http://ethiohelix.blogspot.com/2012/11/extensive-doctoral-thesis-on-ethiopian.html
http://ethiohelix.blogspot.com/2013/01/tmrca-calculations-from-plaster-nry.html
http://ethiohelix.blogspot.com/2013/02/the-zhivotovsky-multiplier.html
http://ethiohelix.blogspot.com/2013/03/african-sahel-ydna.html
The code is written for Octave and is also Matlab compatible. There is also an instruction file that explains how to run the calculator in the folder that is linked above which can also be found below:
---------------------------------------------------------------------------------------------------------
To check if the TMRCA program is correctly working on your system, first run it with the dataset
provided here before trying different datasets, to do so:
(1) Make sure you have Octave loaded on your system (either Windows or Linux will work) and start octave in the command line.
(2) In the command line, change your working directory to the directory where you saved the unzipped folder by using: cd ~PATH/TMRCA_ASD/
If you are unsure of your current working directory, type the command: pwd()
(3) Type: fcompositeTMRCA("Buckova_EM78","all")
(4) If this produces results, then the program and functions are correctly installed and you can proceed to reading and analysing different datasets.
Reading and analysing new Data
After correctly executing the above steps, read and analyse new data by using the following steps:
(1)open the example STR data file in the "TMRCA_ASD/Loaded_Data/" folder entitled "EM35_STR.xls"
(2)Any STR data file to be analysed should first be made in the same format as the "EM35_STR.xls" file , specifically:
(a) DYS names in the first row should have the exact same nomenclature (the orders can be different however).
(b) Each row (except the first) should represent one sample.
(c) Each coloumn (except the first) should represent repeats for one marker/DYS#.
(d) The first column should represent sample identifiers, ex. Kit#, sample ID,...
(e) The cell found in the first row and first column should have the Dataset's name, this will be the same name used throughout the analysis.
(f) No cell shall contain null values and avoid having cells that contain characters which have spaces in between them.
(3) In Excel or openoffice, convert the "EM35_STR.xls" workbook to a ".csv" file by saving the file as "YSTR.csv" and placed into the
same "TMRCA_ASD/Loaded_Data/" folder. The program will only look for a file entitled "YSTR.csv", so make sure that the same name is used for your file.
(4) Start octave, in the command line, change the working directory to "~PATH/TMRCA_ASD/Loaded_Data/"
(5) Type on the octave prompt: readdata
(6) Octave will start reading the dataset and create the file "EM35-Balanced" in the folder "/TMRCA_ASD/Loaded_Data/" when it is finished.
(7) If you want to analyse a specific set of markers from your dataset go to setep 8, otherwise go to step 9
(8) Go to the file "/TMRCA_ASD/Markerlist/49markerlist.txt", and pick the markers you want to use for the analysis. Then save your chosen
markers into a new txt file in the same folder as "/TMRCA_ASD/Markerlist/". Take a look at the file "8_Chiaronimarkerlist.txt" for
an example of how the marker list should look.
(9) In octave, change your working directory back up one level by typing: cd ..
(10) If you are specifying a set of markers to use in the analysis, then run the program by typing: fcompositeTMRCA("EM35-Balanced","8_Chiaronimarkerlist.txt"), otherwise, just type: fcompositeTMRCA("EM35-Balanced","all").
----------------------------------------------------------------------------------------------------------
Update : Version2 - *.CSV read, + Auto path detect. (fcompositeTMRCA.m, fmarkerextract.m, readdata.m)
Update(04/25/13) : Version3 - Add option for using all available markers, print used/unused markers. (fcompositeTMRCA.m, fmarkerextract.m, fAssignmutation.m)
Monday, March 4, 2013
Geno 2.0 YDNA SNP Pathways.
The Geno 2.0 chip tests some 13,000
SNPs on the Y-Chromosome, by far the largest from all commercial DNA companies, in addition, a lot of these SNPs do not
have a place assigned in the YDNA phylogeny, no official phylogeny
has been published yet either.
However, the customers of this project
get the option to transfer the SNPs to FTDNA and thereby join the
numerous grouped projects under the FTDNA umbrella, which then
displays the results of which SNPs they tested positive for.
Although we don't know where most of
these SNPs belong on the YDNA tree, we do know where some of them
belong, and by utilizing the most rudimentary operations of set
mathematics (union, intersection and set difference), in addition to
the positions of the known SNPs in the current YDNA phylogeny tree (ISOGG 2013) it is possible to
segregate these SNPs that appear on the project pages into
phylogenetic pathways.
This posting will change frequently as
more and more kits appear in the FTDNA project pages.
The first thing to realize is that the
following list of 101 SNPs are either erroneous or erroneously
reported and need to be discarded if they appear on any of the
results until FTDNA , NATGEO or whoever else is responsible fixes
them,
CTS1034+ CTS10436+ CTS10713+ CTS10738+
CTS11085+ CTS11454+ CTS11844+ CTS12173+ CTS2080+ CTS2223+ CTS230+
CTS2447+ CTS295+ CTS3234+ CTS335+ CTS3647+ CTS3763+ CTS3914+ CTS4276+
CTS4623+ CTS4714+ CTS477+ CTS5458+ CTS5580+ CTS6010+ CTS6353+
CTS6384+ CTS6891+ CTS7453+ CTS7492+ CTS7859+ CTS7951+ CTS8133+
CTS8178+ CTS8244+ CTS9096+ CTS947+ CTS9512+ CTS9548+ F1173+ F1221+
F1300+ F1327+ F1369+ F1707+ F1754+ F1831+ F1833+ F1842+ F1870+ F1882+
F2000+ F2137+ F2150+ F2177+ F2223+ F2494+ F2503+ F2546+ F2631+ F2845+
F2887+ F2932+ F3035+ F3039+ F317+ F3187+ F3225+ F3394+ F3397+ F3455+
F375+ F3948+ F3965+ F4131+ F4277+ F830+ F842+ F869+ F889+ F910+ F942+
F943+ F969+ L366+ L477+ L493+ L515+ L516+ L517+ L552+ L594+ M263+
PF4208+ PF4330+ PF5061+ PF6868+ PF7392+ Z148+ Z191+ Z365+
Notes : Unions will be listed without symbol, ex Set ABC = Set ( (A ∪ B) ∪ C)
Known SNP identification is all based on ISOGG 2013 only.
Known SNP identification is all based on ISOGG 2013 only.
Pathway from root to CT-M168 (=Set # A)
Set2
: Kit # N94262, R-M343+
Binary
Operation: Set1 ∩
Set2
Number
of SNPs: 77
CTS10362+ CTS109+ CTS11358+
CTS11575+ CTS125+ CTS1996+ CTS3331+ CTS3431+ CTS3662+
CTS4364+ CTS4368+ CTS4740+ CTS5318+ CTS5457+ CTS5532+ CTS6383+
CTS6800+ CTS6907+ CTS7922+ CTS7933+ CTS8243+ CTS8980+ CTS9828+
L566+ L781+ M139+ M168+ M294+ M42+ M94+ PF1016+ PF1029+
PF1031+ PF1040+ PF1046+ PF1061+ PF1092+ PF1097+ PF110+
PF1203+ PF1269+ PF1276+ PF15+ PF192+ PF210+ PF212+ PF223+
PF234+ PF258+ PF263+ PF272+ PF278+ PF292+ PF316+ PF325+
PF342+ PF500+ PF601+ PF667+ PF719+ PF720+ PF725+ PF779+
PF796+ PF803+ PF815+ PF821+ PF840+ PF844+ PF892+ PF937+
PF951+ PF954+ PF970+ V189+ V52+ V9+
Identified as same level as BT
Identified as same level as CT-M168
Identified as same level as P <---- Looks unreliable and maybe a false positive report.
Identified as same level as P <---- Looks unreliable and maybe a false positive report.
Thursday, February 21, 2013
The Zhivotovsky Multiplier
It is reported that Zhivotovsky's
effective mutation rate
[1]
has the effect of increasing the TMRCA of a lineage, as computed by
the use of Microsattelite Genetic
Distances[2],
by a factor of 3-4 fold relative to TMRCAs computed via mutation
rates observed in pedigree and family studies
[3].
By utilizing my TMRCA calculating program,
I want to explore,
- What effect does different marker combinations have on this multiplier ?
- What effect does marker size have on this multiplier ?
- Is there a variation in this multiplier for different data-sets?
First, to ensure that my program correctly calculates the TMRCA when the
Zhivotovsky mutation rate of 0.00069 is applied to all the markers
in my database consistently (versus only the marker specific Pedigree
mutation rates I have thus far been utilizing), I attempted
to replicate the TMRCA computations of the following publication;
The emergence of Y-chromosome haplogroup J1e among Arabic-speaking populations Chiaroni et al. (2009)
Monday, November 26, 2012
Extensive Doctoral Thesis on Ethiopian Y and mtDNA
I was contacted earlier by Dr. Chris Plaster about a doctoral thesis on Ethiopian Y & mtDNA that was completed 2 years ago but had been embargoed to the public until only about two months ago. As this is the first time I am coming across of it, plus since it is 204 pages long I have not had a chance to go through it thoroughly, but suffice it to say that this is the most extensive work on Ethiopian NRY & mtDNA that I have seen to date, although the resolution leaves a lot to be desired, I will update this post more as I read it more thoroughly over the next few days/weeks...


Variation in Y chromosome, mitochondrial DNA and labels of identity on Ethiopia
Some numbers and figures that caught my attention at first glance:


 |


The Discussion section also has some interesting things to say, especially with respects to haplogroups A3b2 and J, but also the remaining ones found in Ethiopia as well.
Thursday, January 19, 2012
The Mother of Mothers !


It has been well known for about 20 years now that the mother of all Non-Africans, and indeed a lot of Africans, was an East African woman, in more recent nomenclature this woman has been called L3, so what do geneticists recently say about this woman, mother to greater than six and a half billion people on Earth, including many who still inhabit her original homeland?
The most recent study conducted to uncover the story behind L3 and her compatriots was one from the end of last year entitled “The Expansion of mtDNA Haplogroup L3 within and out of Africa”.
This important study capped the timing of the out of Africa migrations, which all contemporary men and women outside of Africa are descended from, to no earlier than Seventy Thousand Years Ago.
The basis for this reasoning can be found in this paragraph from the text:
“The time window for the out-of-Africa migration on the basis of mtDNA lies between the emergence of haplogroup L3 in Eastern Africa and its derivative non-African haplogroups M and N, which most likely arose during the departure or outside Africa (Richards et al. 2006).”
Meaning, since all Non-Africans are descended from this woman, the timing of the out of Africa migration can not be any older than when she lived and can not be any younger than when here descendant daughters M and N lived, although there still remains a possibility that M and N emerged in Africa, albeit increasingly unlikely.
The expansion of L3 however has been linked in the past to not only the Out of Africa expansion but also Expansions within Africa, generally in association with two different episodes:
- With the spread of Pastoralism in the Sahara of the early Holocene
- With the Bantu Expansion/s
“We collected a total of 102 Sudanese, 77 Ethiopian (both emigrants in Dubai), and 148 Somali (refugees in Yemen) samples, belonging to unrelated individuals, who gave appropriate informed consent for their biological samples to be used for mtDNA characterization.”
Where a set of identified L3 lineages from above (plus other previous papers) were then selected for complete mtDNA sequencing:
“We selected for complete mtDNA sequencing a total of 21 Sudanese, 16 Ethiopian, and 20 Somali samples chosen from the sequences characterized in this work, and 11 from Chad and 2 from Soqotra belonging to haplogroup L3 from data sets published previously (Cerny´ et al. 2007; Cerny´, Pereira, et al. 2009).”
So what were the main results of the extensive statistical analysis done on this lineage?
A) Complete mtDNA phylogeny for Haplogroup L3:

Schematic tree of haplogroup L3. Age estimates are respectively rho estimates from the complete mtDNA genome (black font), rho estimates using the synonymous clock (gray font), and ML estimates using the complete mtDNA genome (black font underlined). Color scheme for each clade indicates the probable geographic origin. Haplogroups M and N are indicated and age estimates are according to Soares et al. (2009). MSA refers to Middle Stone Age and LSA to Late Stone Age.
B) Reaffirmation of what was known in the past with respect to the origins of L3:
“L3 most likely had an origin in Eastern Africa (Torroni et al. 2006). This is supported by the presence of all major branches, with L3a and L3h virtually specific to the region and L3eikx and the L3f haplogroups having a probable origin there as well, whereas for L3bcd, the region of origin is less clear and will be discussed in more detail below. The other two main branches of L3, M and N, exist only outside Africa, except for some back-migrations into Africa around 50–30 ka in the form of haplogroups U6 and M1 (Olivieri et al. 2006; Pereira et al. 2010) and some more recent intrusions (Cherni et al. 2009; Ottoni et al. 2010). Since there is strong evidence that the dispersal out of Africa was via the Horn, soon after L3 arose (Macaulay et al. 2005), the distribution of M and N also points to Eastern Africa as the center of gravity for L3.”
C) Temporal analysis of the sampled L3 lineages with origins bracketed within 60 – 70 thousand years ago:
"It seems likely that L3 dates somewhere between 60 and 70 ka, as the TMRCA estimates vary between 58.9 ka (using rho and the complete genome) and 70.2 (using ML), with the synonymous clock providing a value between the two (63.1 ka). We checked if the L3 tree rejected a strict molecular clock by running the ML analysis without stipulating a molecular clock and performing a likelihood ratio test that clearly did not reject the clock hypothesis (P 5 0.9899). These results led us to consider an age of 65 ka (varying between 60 and 70 ka in the 95% percentile) in the internal calibration of BEAST, as there was no other reliable calibration point we could use. The ages using the complete genome and the synonymous clock were 1.04 and 0.97 times the BEAST estimates, respectively, indicating that the BSPs were calculated using a similar rate to the other analyses, as we intended.”
D) Identification of 3 main episodes of population growth/expansion within Africa:
i) Approximately 40 thousand years ago corresponding with the emergence of the various intra-African subclades of L3.
ii) Around the Holocene, associated mainly with L3bd and L3e (Central Africa)
iii) The largest increase of the expansions detected around four thousand years ago and most pronounced in the Central African Bayesian Skyline Plots.
E) L3f and L3eikx both implied to have an origin in Eastern Africa. Where L3f was carried into the Sahel and Central Africa, with L3f3 specifically expanding into the Sahel 8 to 9 thousand years ago.
F) The most frequent clade of L3, i.e. L3e implied to have an origin in Central/Western Africa. With Eastern African L3e discounted as more recent introgression from there.
G) An ambiguous interpretation for the origin of L3bcd, a tentative east African origin is however suggested:
“L3bcd has three main subclades, with L3b and L3d tentatively united by a transition at control region position 16124 to form the putative subclade L3bd. The great age of L3bcd and its wide distribution across Africa makes phylogeographic inferences difficult. Furthermore, L3c is extremely rare: Only two samples have been detected so far, one in Eastern Africa and the other in the Near East. This might echo an early origin of L3bcd in Eastern Africa, before moving west, but its rarity makes this conclusion extremely tentative. In a scenario of an early origin of L3bcd in Eastern Africa, M and N would be the only subclades of L3 to have most likely originated outside of Eastern Africa (although an origin in Eastern Africa remains possible: Richards et al. 2006).
H) A virtual exclusion of a scenario in which the ancestors of contemporary people outside of Africa migrated out of Africa before the eruption of Toba.
I) And finally the most interesting part of this paper's conclusion, a unified demographic process that led to both the out-of-Africa and within Africa primary expansion of L3:
“Furthermore, since the age of the M and N Eurasian founders of ;50 to 65 ka (Soares et al. 2009) is close to the age of their ancestral L3 clade in Africa, the out of-Africa dispersal may have been of a piece with the initial diversification and expansion of L3, so that the L3 expansions in Eastern Africa and the exit of modern humans from Africa;60 ka were all part of a single demographic process.
It seems likely that the moister climate after;70 ka in Eastern Africa allowed dramatic human population growth (Scholz et al. 2007), perhaps associated with improved hunting, marine exploitation, exchange networks, and possibly even plant food management strategies as suggested by Mellars (2006). This generated the oldest major signal of expansion in the human mtDNA tree, the radiation of L3, leading rapidly to the spread of H. sapiens toward the rest of the world. It is worth stressing that this signal is not reflected in other mtDNA lineages at this time (Behar et al. 2008). Within Africa, the Pleistocene migrations detected in the L3 pool were responsible for the introduction of L3bd and L3e into Central Africa in the period between 60 and 35 ka (fig. 5A), but none reached Southern Africa at that time.”
Interestingly, the previous explanations that the Out of Africa expansion of modern humans being linked with behavioral modern thinking is largely dismissed by these authors for the sole explanation of Environmental factors, their main reasoning being that there is evidence for behavioral modernity of humans in Africa (Both in South and North Africa) long before their proposed timing of the OOA migrations.
“Thus, as suggested by Basell (2008), the demographic expansions that led to the first successful dispersal out of Africa seem better explained by the play of palaeoenvironmental forces than by recourse to the advantages of ‘‘modernity."
More interesting figures from the paper:

“Frequency maps based on HVS-I data for haplogroups L3a, L3i, L3h, and L3x combined (A), L3f (B), L3e (C), L3b (D), and L3d (E).”

“Outline of the main dispersals detected in this work during the Pleistocene (A) and the Holocene (B).”
** Sketches on top of page depicting contemporary women that still live in the putative land of L3's origin. Credit goes to Ethiopian Artist Adis Gebru and taken from this blog.
Sunday, November 22, 2009
Y-DNA Variation Maps For East Africa
The supplementary information of the Chiaroni et. al 2009 paper "Y chromosome diversity, human expansion, drift, and cultural evolution", has some informative Y-DNA frequency distribution maps for the major globally distributed haplogroups. Here are the frequency distribution maps pertinent to East Africa (namely Ethiopia and periphery).
1) Estimated and calculated centroids location map (Fig. S4 -b)


5) Haplogroup J frequency distribution (Fig. S5 -a)


1) Estimated and calculated centroids location map (Fig. S4 -b)

Note: Centroids are not necessarily indicative of origin, diversity of the lineages in question are a better indicator of origin.
2) Haplogroup A frequency distribution (Fig. S2 -b)

"Haplogroups A and B are the deepest branches in the phylogeny and are essentially restricted to Africa, bolstering the evidence that modern humans first arose there (14, 15). Haplogroup A is mainly found in the Rift Valley from Ethiopia to Cape Town, mostly but not exclusively in some of the oldest hunter-gatherers who still survive and speak Khoikhoi and San languages, proposed by some to be the oldest languages. The interruption of its distribution in the middle of the Rift Valley is possibly the consequence of replacement by Bantu-speaking farmers who settled the region starting in the first millennium of the Christian era."
The "Max" of 11.5% A3b2 (M13) shown above seems a bit low at first glance for East Africa, Semino et. al 2002 and Cruciani et. al 2002 together found 24 A3b2 lineages out of a total of 148 sampled in Ethiopia; Amhara (48), Oromo(78), Beta Israel (22). However, if the results of the Hassan et. al 2008 study of Sudan and the Sanchez et. al 2005 study of Somalia are added to the studies above, the frequency of A3b2 drops from ~16% in just Ethiopia to ~11.5 % (75 / 650) when Sudan and Somalia are included. Also important to note is that the Beta Israel, Dinka, Shiluk, Nuer and Nuba all carry anywhere between 33% and 62% of A3b2 lineages.
3) Haplogroup B frequency distribution (Fig. S1 -a)

"Haplogroup B is found mainly among African Pygmies, who live in the central African forest and are still predominantly hunters-gatherers but speak Bantu languages borrowed from farmers who arrived in the area between 2,000 and 3,000 years ago."
Haplogroup B is found at low levels in Ethiopia, with frequencies varying anywhere between 0 - 2% ( Cruciani et. al 2002, Semino et. al 2002, Moran et. al 2004). The haplogroup is however much more common in Sudan, with frequencies reaching as high as 50% in the Nuer. Generally, frequencies of Haplogroup B are found any where between 8% and 27% in the Sudan among the Nubians, Nuba, Copts, Hausa, Dinka and Shilluk. (Hassan et. al 2008)
4) Haplogroup E frequency distribution (Fig. S1 -b)

"The third predominantly African haplogroup, E, diversified some time afterward, probably descending from the East African population that generated the Out of Africa expansion. The geographic distributions of the major branches of this haplogroup, given in Fig. S1b, suggest that most of the settlement outside of Africa by haplogroup E members involves the later mutant E-M35 varieties like M78, M81, and M123 that extended to Arabia and the northern Mediterranean coast."
5) Haplogroup J frequency distribution (Fig. S5 -a)

Further information on Haplogroup J in Ethiopia can be found in: Semino et. al 2002, Moran et. al 2004, Tofanelli et. al 2009, Chiaroni et. al 2009.
6) Genetic Diversity as a function of Distance from Addis Abeba (Fig. S6 -a)

Wednesday, November 4, 2009
Cruciani et. al 2007
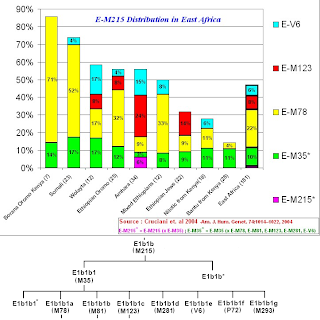
Cruciani et. al 2007, discusses the E1b1b1a (E-M78) sub lineage of E1b1b (E-M215) in further detail. The entire data for East Africa comes from the Cruciani et. al 2004 study, while for North Eastern Africa, in addition to the samples taken from the same paper, it includes some newer samples from; Libyan Jews, Libyan Arabs, Egyptian Berbers, Egyptians from Baharia and Egyptians from Gurna Oasis. The Phylogeny of E-M78, is further finely resolved into a new series of "V" sub clades as seen below (Taken from Figure 1)

A "Corridor for bidirectional migrations between East Africa and North East Africa" is proposed as a result of the paper's findings:
"E-M78 belongs to clade E3b (E-M215). On the basis of robust phylogeographic considerations, an eastern African origin has been proposed for E-M215 (Underhill et al. 2001; Cruciani et al. 2004), with a coalescence time of 22.4 ky (95% C.I. 20.9-23.9 ky; recalculated from Cruciani et al. 2004, see Materials and Methods). A north-eastern African origin for haplogroup E-M78 implies that E-M215 chromosomes were introduced in north-eastern Africa from eastern Africa in the Upper Paleolithic, between 23.9 ky ago (the upper bound for E-M215 TMRCA in eastern Africa) and 17.3 ky ago (the lower bound for E-M78 TMRCA here estimated, fig. 1). In turn, the presence of EM78 chromosomes in eastern Africa can be only explained through a back migration of chromosomes that had acquired the M78 mutation in north-eastern Africa."
1) E1b1b1a (E-M78) frequencies in East African populations.

Above, it is clear that only sub clades E-V32 and E-V22 dominate in East African E-M78.


Battaglia et al. 2008:
"Y-chromosomal evidence of the cultural diffusion of agriculture in southeast Europe"

A "Corridor for bidirectional migrations between East Africa and North East Africa" is proposed as a result of the paper's findings:
"E-M78 belongs to clade E3b (E-M215). On the basis of robust phylogeographic considerations, an eastern African origin has been proposed for E-M215 (Underhill et al. 2001; Cruciani et al. 2004), with a coalescence time of 22.4 ky (95% C.I. 20.9-23.9 ky; recalculated from Cruciani et al. 2004, see Materials and Methods). A north-eastern African origin for haplogroup E-M78 implies that E-M215 chromosomes were introduced in north-eastern Africa from eastern Africa in the Upper Paleolithic, between 23.9 ky ago (the upper bound for E-M215 TMRCA in eastern Africa) and 17.3 ky ago (the lower bound for E-M78 TMRCA here estimated, fig. 1). In turn, the presence of EM78 chromosomes in eastern Africa can be only explained through a back migration of chromosomes that had acquired the M78 mutation in north-eastern Africa."
1) E1b1b1a (E-M78) frequencies in East African populations.

Notice here also the combination of the "Borana Oromo Kenya" (N=7) and the "Ethiopian Oromo" (N=25) samples taken from Cruciani et. al 2004, as a new group coined as "Borana/Oromo (Kenya/Ethiopia)" (N=32) in this study.
2) E1b1b1a (E-M78) frequencies in North East African populations.

"North Eastern Africa", has a much more richer subclade diversity of E-M78, than "Eastern Africa", which makes sense as to the current assumption of E-M78's origin in the Egypt/Sudan locality. See also Battaglia et al. (2008).
3) Microsatellite Networks for E-V12, E-V22 and E-V65.

(Taken from Fig. 3)
Microsatellite networks of haplogroups E-V12 (A); E-V22 (B); and E-V65 (C). In network (A), a dotted circle includes all of the E-V12 chromosomes carrying the V32 mutation. Branch lengths are proportional to the number of one-repeat mutations separating 2 haplotypes. Each circle area is proportional to the frequency of the sampled haplotype.
4) Comparing Cruciani '07 results to the E3b Project.

Notice on the comparison of the results of Cruciani '04 to the E3b project that there is an imbalance of E-M78 lineages (in favor of the E3b Project), above we can see that this imbalance is further characterized by the marked abundance of E-V13 lineages in the E3b Project, this makes sense because E-V13 is for the most part found only in Europe, and Europeans have better financial and technological access to participate in private DNA testing.
5) Further reading and sources on E-M78.
Hassan et. al 2008:
"Y-Chromosome Variation Among Sundanese: Restricted Gene Flow, Concordance with Language, Geography, and History"
Sanchez et. al 2005:
"High Frequencies of Y Chromosome Lineages Characterized by E3B1, DYS19-11, DYS392=12 in Somali Males"Battaglia et al. 2008:
"Y-chromosomal evidence of the cultural diffusion of agriculture in southeast Europe"
Wednesday, October 21, 2009
Cruciani et. al 2004
Cruciani et. al 2004, is perhaps the best comprehensive study that we currently have with respect to the signature paternal haplogroup that is most abundant among males of Eastern and Northern Africa, E1b1b.
The haplogroup is most likely of indigenous Eastern African origin according to the paper:
We obtained an estimate of 25.6 thousand years (ky) (95% CI 24.3–27.4 ky) for the TMRCA of the 509 haplogroup E3b chromosomes, which is close to the 30 +/-6 ky estimate for the age of the M35 mutation reported by Bosch et al. (2001) using a different method. Several observations point to eastern Africa as the homeland for haplogroup E3b—that is, it had (1) the highest number of different E3b clades (table 1), (2) a high frequency of this haplogroup and a high microsatellite diversity, and, finally, (3)the exclusive presence of the undifferentiated E3b* paragroup.
Note: E3b here refers to the Y- DNA lineage that is defined by E-M215 (as seen below taken from Figure 1) and is referred by current nomenclature as E1b1b.
1) E1b1b (E-M215) frequencies in East African populations.

The paper states that the Kenyan Bantu data comes from "Human Genome Diversity Project/CEPH DNA panel (Cann et al. 2002)", while I have not (as of yet) seen the precise data, one can speculate that the majority of the E-M96 lineages that are non E-M215 found in the Kenyan Bantu probably belong to E1b1a (E-M2).
The paper also states that for the Ethiopian Jews (A.K.A Bete Israel) the data comes from "Cruciani et al. 2002", from this paper we can glean that the lineages described as E-M96 but not downstream of E-M215, all belong to E3* (x E-M2), which in current nomenclature would translate to E1b1* (E-PN2*), while noting that a slight chance exists that said lineages could belong to the later found subclade of E1b1 now known as E1b1c (E-M329).
Unfortunately, for the sampled populations (other than the Kenyan Bantu and Ethiopian Jews), no further data is given to clarify the composition of the E-M96 (x E-M215) lineages.
3) Breakdown of the 515 E-M215 lineages found in this study.

The haplogroup is most likely of indigenous Eastern African origin according to the paper:
We obtained an estimate of 25.6 thousand years (ky) (95% CI 24.3–27.4 ky) for the TMRCA of the 509 haplogroup E3b chromosomes, which is close to the 30 +/-6 ky estimate for the age of the M35 mutation reported by Bosch et al. (2001) using a different method. Several observations point to eastern Africa as the homeland for haplogroup E3b—that is, it had (1) the highest number of different E3b clades (table 1), (2) a high frequency of this haplogroup and a high microsatellite diversity, and, finally, (3)the exclusive presence of the undifferentiated E3b* paragroup.
Note: E3b here refers to the Y- DNA lineage that is defined by E-M215 (as seen below taken from Figure 1) and is referred by current nomenclature as E1b1b.

1) E1b1b (E-M215) frequencies in East African populations.

It's important to note here that after the publishing of this paper, a new SNP downstream of E-M35 and parallel to E-M78, E-M81, etc... was found by Henn et. al 2008, this new sub lineage of E1b1b1 (E-M35) was coined as being E1b1b1g (E-M293), therefore, some of the lineages labeled as E-M35* above could indeed turn out to be part of this newly discovered lineage, however, this is unlikely because E-M293 is more predominent in areas further south from the Horn of Africa according to Henn et. al.
2) E-M96 (xM215) + E-M215 with down stream clades

E-M96 is the upstream ancestor, 3rd node up (including the E-M215 node), of E1b1b. It is the macro haplogroup which includes some 70% of the male lineages found on the African continent.
The purpose of the above graphic is to give a general sense of the ratio of E lineages without the E-M215 mutation to that of E lineages with the E-M215 mutation for populations in East Africa.
Notice that this ratio is at a Maximum (~5.3) for "Bantus from Kenya", while it is at a Minimum (0) for "Somalis", while the average for all the Eastern African populations sampled is ~0.5.The paper states that the Kenyan Bantu data comes from "Human Genome Diversity Project/CEPH DNA panel (Cann et al. 2002)", while I have not (as of yet) seen the precise data, one can speculate that the majority of the E-M96 lineages that are non E-M215 found in the Kenyan Bantu probably belong to E1b1a (E-M2).
The paper also states that for the Ethiopian Jews (A.K.A Bete Israel) the data comes from "Cruciani et al. 2002", from this paper we can glean that the lineages described as E-M96 but not downstream of E-M215, all belong to E3* (x E-M2), which in current nomenclature would translate to E1b1* (E-PN2*), while noting that a slight chance exists that said lineages could belong to the later found subclade of E1b1 now known as E1b1c (E-M329).
Unfortunately, for the sampled populations (other than the Kenyan Bantu and Ethiopian Jews), no further data is given to clarify the composition of the E-M96 (x E-M215) lineages.
3) Breakdown of the 515 E-M215 lineages found in this study.

This paper serves as a benchmark for E1b1b, since it did the most extensive study of the lineage on a global level:
"We explored the phylogeography of human Y-chromosomal haplogroup E3b by analyzing 3,401 individuals from five continents."
Out of the 3,401 individuals, 515 or 15.1% were found to belong to E1b1b (E-M215) :
Out of the 3,401 individuals, 515 or 15.1% were found to belong to E1b1b (E-M215) :
"Five hundred fifteen haplogroup E3b subjects were identified and further analyzed for the biallelic markers M34, M78, M81, M123, M281 (Underhill et al. 2000; Seminoet al. 2002), and V6."
It should be noted again that the 9% of E-M35* lineages found include those also found in Southern Africa among the Kung, Khwe and Bantu, but as stated above, these E-M35* lineages probably belong to the later found subclade E-M293 per the Henn et. al 2008 paper, in that event the share of E-M35* lineages found would probably drop by ~3%.
4) Microsatellite Networks for the main sub-lineages and E-M35*

(taken from Figure 2):
Microsatellite networks of E3b haplogroups. A, E-M35*. B, E-M78. C, E-M81. D, E-M34. Reduced-median and median-joining procedures (Bandelt et al. 1995, 1999) were applied sequentially. A haplogroup-specific weight proportional to the reciprocal of microsatellite variance was used in the construction of the networks. The E-M78 unweighted network (not shown) gave the same quadripartite structure. Unassigned chromosomes (B) showed an intermediate position between clusters "alpha" and "delta" in the unweighted network. Microsatellite haplotypes are represented by circles, with areas proportional to the number of individuals harboring the haplotype. Branch lengths are proportional to the number of one-step mutations separating two haplotypes.
The Alpha, Beta, Delta and Gamma clusters of E-M78 found in this study were investigated later in Cruciani et. al 2007 and were assigned to a new set of SNP's downstream of E-M78 known as the V-series. As a matter of fact, the sole focus of Cruciani et. al 2007 with respect to E lineages was on E-M78.
5) Comparing Cruciani '04 results to the E3b Project

The E3b project, has an on going and a real time database of people who have tested positive for the E-M35 lineage and further downstream sub-lineages. As such, it is a good tool for testing the findings of Cruciani '04. Above, you can see such a test done by me comparing the relative frequency of E-M35 subclades found in Cruciani '04 to that of the E-M35 deep clade test results from the E3b project as of October 2009.
Further peer reviewed sources on E1b1b and it's subclades can be found below:

Table above taken from : A review paper on E-M35 by Andrew Lancaster 2009
Subscribe to:
Posts (Atom)

