Saturday, March 31, 2012

Cross Validating and K Selection


There are two ways of choosing a K value for any given dataset that one wishes to perform an ADMIXTURE run on, one is to throw a dart at a random set of numbers and hope it works out for the very best, the other is to run ADMIXTURE at different K's while computing a cross validation error for each of the K values using the --cv flag, I did this with the studentized global dataset that I discussed earlier in this post. The Cross Validation error values for K 1-14 for that particular dataset can be seen in the graphs below,

close up :
While the CV-Error values do not start flattening out until about K=10, the CV error values do not start inflecting until K=13, meaning K=13 is the appropriate choice for this dataset.

Cross Validation can take a considerably long time to run, as each consecutive K has to be evaluated along with its error separately, unless one has access to a very fast machine off-course.

As a reference, the Bash shell code to run Cross Validation in ADMIXTURE for up-to K=14 is:

for K in 1 2 3 4 5 6 7 8 9 10 11 12 13 14; \
do ./admixture32 -j2 --cv=14 “filename.bed” $K | tee log${K}.out; done

where CV error values will be recorded in the .out files for each K.

Peaking populations for each cluster for K =2-13

K=2
Cluster1: pygmy,mbutipygmy,sotho/tswana,biakapygmy,fang

Cluster2: chinese-americans,tujia,miao,hezhen,han

East Asians and Africans split, with West Asians and Europeans belonging to 1/3 African and 2/3 East Asian, the reverse is seen with Ethiopians, 2/3 African and 1/3 East Asian.


Tuesday, March 27, 2012

Reconstructing ancient mitochondrial DNA links between Africa and Europe

Abstract

Mitochondrial DNA (mtDNA) lineages of macro-haplogroup L (excluding the derived L3 branches M and N) represent the majority of the typical sub-Saharan mtDNA variability. In Europe, these mtDNAs account for <1% of the total but, when analyzed at the level of control region, they show no signals of having evolved within the European continent, an observation that is compatible with a recent arrival from the African continent. To further evaluate this issue, we analyzed 69 mitochondrial genomes belonging to various L sublineages from a wide range of European populations. Phylogeographic analyses showed that ∼65% of the European L lineages most likely arrived in rather recent historical times, including the Romanization period, the Arab conquest of the Iberian Peninsula and Sicily, and during the period of the Atlantic slave trade. However, the remaining 35% of L mtDNAs form European-specific subclades, revealing that there was gene flow from sub-Saharan Africa toward Europe as early as 11,000 yr ago. 

Wednesday, March 21, 2012

A Supervised Global ADMIXTURE Run


A supervised ADMIXTURE run, assumes that certain populations within a given dataset are 100% of a certain ancestry, so for instance, given one wants to run ADMIXTURE at K=10 in supervised mode, then 10 different populations that are assumed to come from the 10 putative ancestral clusters that the software will infer, or rather will be forced to infer, must be manually selected.

I wanted to explore this type of a run on a global basis and purposefully select populations that not only may form their own clusters in an unsupervised run, but are also thought to be within the 'trunk', bifurcation 'nodes' and end 'branches' of the ancestral 'tree' of all people.
  
The basis of this run is the global dataset than can be downloaded in PLINK format from here. The dataset, a superset of the African dataset that I have been thus far utilizing, contains 3,970 individuals from around the world typed at 27,022 genome-wide SNPs.
A 3 dimensional, as well as a dim1 vs dim2, MDS plot labelled according to the median coordinates of the population groups for this dataset can be seen below:


The general structure of a globally spread PCA/MDS plot is well known and understood, the first principal component, describing the highest variation of all the components, separates Africans from non-Africans, while the second principal component separates West Asians/Europeans from East Asians, Oceanians and Native Americans. The 3rd principal component can be however shaky, in the plot above it separates Native Americans from the rest, however other sources have shown that the 3rd principal component in a global PCA separates divergent hunter gatherers (like the Hadza, Sandawe, San and Pygmies) from every body else, perhaps a 3-D PCA generated from full genome scans will put this to rest once and for all.

Friday, March 16, 2012

Introducing Yemenis into the Afrasan dataset.


This is about an observation made when I introduced the Yemenis (from Behar (2010)) into an ADMIXTURE analysis of the Afrasan Dataset (x Mozabites)

Monday, March 12, 2012

TreeMix analysis on the African Dataset


Thanks to a commenter going by the moniker 'Eze', who notified me the other day of a new program called Treemix, in which it infers “patterns of population splitting and mixing from genome-wide allele frequency data”, I had a chance to give it a try on the Intra-African Dataset that I have described previously.

After converting the input file into the desired format, I decided to play with several of its functionalities to become familiar with it,
 
1) Default Maximum Likelihood (ML) Tree,


2) Default ML graph with 4 assumed migrations,


 3) ML graph rooted with the San-nb,

  
4) ML graph with 4 migrations and rooted with the San-nb.

A remaining option of the software that I have not as yet tried is that which groups SNPs together to account for linkage disequilibrium. 

Other than that, the results are quite as expected, the North Africans are shown in both the default and rooted trees, but especially with the San-n rooted tree, as a branch of East Africans, and where East Africans in turn are seen as a branch of other Africans, consistent with evidence from uni-parental markers, as well as published papers, for an East African genesis of Eurasians, of which North-Africans can be used as a proxy for this particular Dataset.

The 4 inferred migrations in order of decreasing edges were;

-(Biaka Pygmy, Ancestral Sotho/tswana) → Sandawe, Migration edge:0.457032; likely an old hunter gatherers link. This was noted by Tishkoff (2009) : “These results suggest the possibility that the SAK, Hadza, Sandawe, and Pygmy populations are remnants of an historically more widespread proto-Khoesan- Pygmy population of hunter-gatherers.”

-(!kung,Ancestral to Biaka and Mbuti Pygmies) → Hadza,
Migration edge:0.44087; potentially another early hunter gatherers link.

-Ethiopian Jews → San,
Migration edge:0.188914; this could be a relic of early hunter-gatherer connections with Ethiopia (See: Ethiopians and Khoisan share the deepest clades of the human Y-chromosome phylogeny.) Another possible connection for this could be the migration of YDNA E1b1b1b2b (E-M293) carriers from Eastern Africa to Southern Africa within the past few millennia.

-Mbuti Pygmy → Alur,
Migration edge:0.140627; this was also picked up by the ADMIXTURE analysis, where the Alur had significant amounts of Mbuti and Biaka pygmy components.

Further reading on the details behind the software featured in this post, TreeMix, can be found here: http://hdl.handle.net/10101/npre.2012.6956.1.


UPDATE: Run another one again rooted with the SAN from Namibia and 10 migrations assumed and got the following results, left column is Migration edge weight

0.586693 luhya →hema,hadza
0.508001 egyptans → EtA
0.504407 egyptans → EtT
0.442291 egyptans → Ethiopian-jews
0.432858 moroccans → fulani
0.27746 mbutipygmy,pygmy → sandawe
0.203223 mbutipygmy,pygmy → hadza
0.156929 egyptans → maasai
0.154406 moroccans → san
0.129901 pygmy → alur


Some of the results from the previous 4 assumed migrations run disappeared, it is not clear if migrations inferred from a lower m assumption are more statistically significant than those inferred from higher m assumptions. In general, this newer run resembles more of the K10 ADMIXTURE run, however there are some obscure differences, for instance, while it picked up a North to East African migration in the EtA, EtT and EtJ samples, it skipped the EtO samples and then picked up the same migration pattern in the maasai samples, whom had a lower 'North-African' component in the K10 ADMIXTURE run than the EtO samples. My take on this is that the program is not yet sophisticated enough to accommodate for bidirectional migrations that have happened for thousands of years, like the ones that have taken place between East and North Africa for instance. Indeed the authors of the software do list the following pertinent point as one of their assumptions:

"We also have modeled migration between populations as occurring at single, instantaneous time points."

and

"This model will work best when gene flow between populations is restricted to a relatively short time period. The relevance of this assumption will depend on the species and the populations considered."

UPDATE2: Residual plot for 10 migrations rooted with the San-nb.

Thursday, March 8, 2012

Afrasans in a Genome-Wide context.


A subset of the Intra-African dataset I have includes Afrasans, or Afroasiatic speakers. Afroasiatic is typically divided into 6 major categories or groups; Semitic, Berber, Egyptian, Chadic, Cushitic and Omotic. A 7th, but nearly extinct group, known as Ongota is contentious, but is by some included as its own branch within the Afroasiatic phylum. All of these Language groups, with the exception of Semitic, are exclusively found in Africa. The 211 Afrasan samples in the dataset belong to 4 or 5 of those groups mentioned, depending on how one accounts for any language shifts (that is shifts within the wider Afrasan phylum) that might have occurred. A rough table is shown below associating the 211 samples with current, and in some cases previously spoken language or language groups of Afroasiatic.

 
In general, Afroasiatic is thought to have emerged somewhere in the North Eastern section of Africa, anywhere from Ethiopia to Southern Egypt, in the genetic (Autosomal) sense, this area can perhaps be viewed as where such populations inhabiting that area in Africa, lie along a diagonal axis of the C1 vs C3 Intra- African MDSplot (at ~ 34°
from the horizontal), as highlighted below:
MDS plots
After extracting the 211 AA speaking samples from the 1065 sample African Dataset, I performed an MDS Analysis on it as seen below.
Component 1 separates Berber/Semitic/Egyptian speakers from Chadic speakers, with Ethiopian Semitic/Cushitic speakers plotting somewhere in between, but closer to the former in this separation. Component 2, separates Ethiopians+Egyptians from the rest.
 
Component 3 Separates the Mozabites from the Rest, with Ethiopians again retaining an intermediate position.

Model Based Analysis
The Logical value for a K selection would be 6, i.e. equivalent to the number of known Afroasiatic subgroups, however, since Omotic speakers are not present in the Dataset, I went ahead and run a K=5 unsupervised ADMIXTURE Analysis for the Afrasan Dataset.

The K=5 ADMIXTURE run produced the following FST distances,
 
The biggest separation for both Axis is for the cluster I nicknamed Cushitic, while the Berber, Semitic and Mozabite clusters appear pretty close, with the Mozabites looking a bit isolated.

The Median proportions for the clusters can be seen below.
 
The fact that the mozbites formed their own cluster, is intriguing, although one would suspect that inbreeding may play a role, since it can also be seen how the Mozabites cluster away from other North Africans in the 3D MDS plot, almost forming their own group. 

Therefore, to see what this analysis would look like without the Mozabites, I took all 27 of them out, leaving me with 184 AA speaking samples.

I repeated the same analysis as above on the newer Dataset.

MDS Plots
Components 1 and 2 behaved the same way as when the Mozabites were included, Component 3 however, without the Mozabites, separates Berber and Cushitic speakers from the rest to almost the same degree, unlike when the Mozabites were included.

Model Based Analysis
This second iteration of the Afrasan dataset that did not include the Mozabites created a Cushitic, Chadic, Berber and Egyptian clusters, with a 5th cluster which looked like a relic that is present in trace amounts in all the Afrasan samples except the Mada and Hausa. The Egyptian cluster is also found in highland Ethiopians, it also shows a more frequent occurrence of high Standard Deviation relative to all the other clusters;
 
So the Egyptian cluster looks like it gives less of a linguistic signal than the other clusters, it could potentially be inclusive of a Semitic signal as well as maybe other types of non-Afroasiatic Eurasian affinities.

It would be of great interest to see where Omotic speakears would fit into this analysis.

Tuesday, March 6, 2012

Analyzing the North African cluster


Continuing with  the Intra-African genome-wide analysis, I wanted to further explore the 'North African' Cluster that appeared to be wide spread from East to North and West Africa, 408 individuals out of the 1065 total samples carried the North African cluster at a frequency greater than 5%. With some of these populations showing a relatively high Standard deviation (Normalized with N-1) for that particular cluster. 

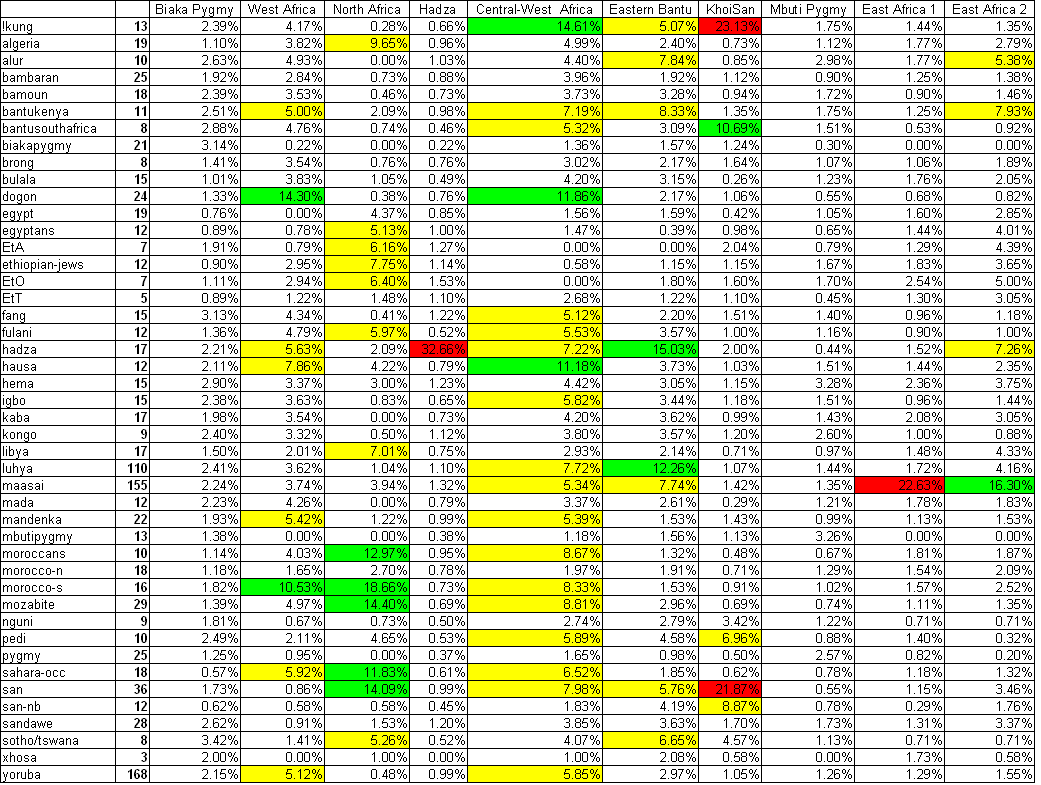
The table below shows the Standard Deviation for each of the 10 clusters found in the Intra-African Genome-Wide Analysis.

Yellow; Moderate Standard Deviation, 5-10%
Green; High Standard Deviation, 10-20%
Red; Very High Standard Deviation, >20%


The North African cluster had a high standard deviation in the Sahara-OCC, Morrocans, SAN, Mozabite and Morroco-S populations. All of these populations however, excluding the SAN, carried the North African cluster, on Median, in very high proportions (> 69%), while the SAN had it on Median only at ~4%. 18 out of the 36 SAN samples did however carry the North African cluster anywhere between 5-56%. Therefore, I excluded these 18 samples from the 408 individuals who carried the North African cluster at greater than 5% and proceeded to create a Dataset with PLINK.

The North African Cluster Dataset thus included 390 individuals (plus a few private samples) typed at 26,129 SNPs (all other specifications held constant with the previous Dataset).
  
MDS Analysis
Here below are the MDS plots for the Dataset, the plots include a 3 Dimensional plot, C1 Vs. C2 plot and C1 vs. C3 Plot respectively.


The 1St component separates North Africans from the rest, with Ethiopians and Fulanis located at an intermediate position in this separation. The  2nd component separates West Africans from the rest, with Bantus (Kenya and South Africa) located at an intermediate position in this separation. The Last and 3rd component separates the Sandawe from everybody else.

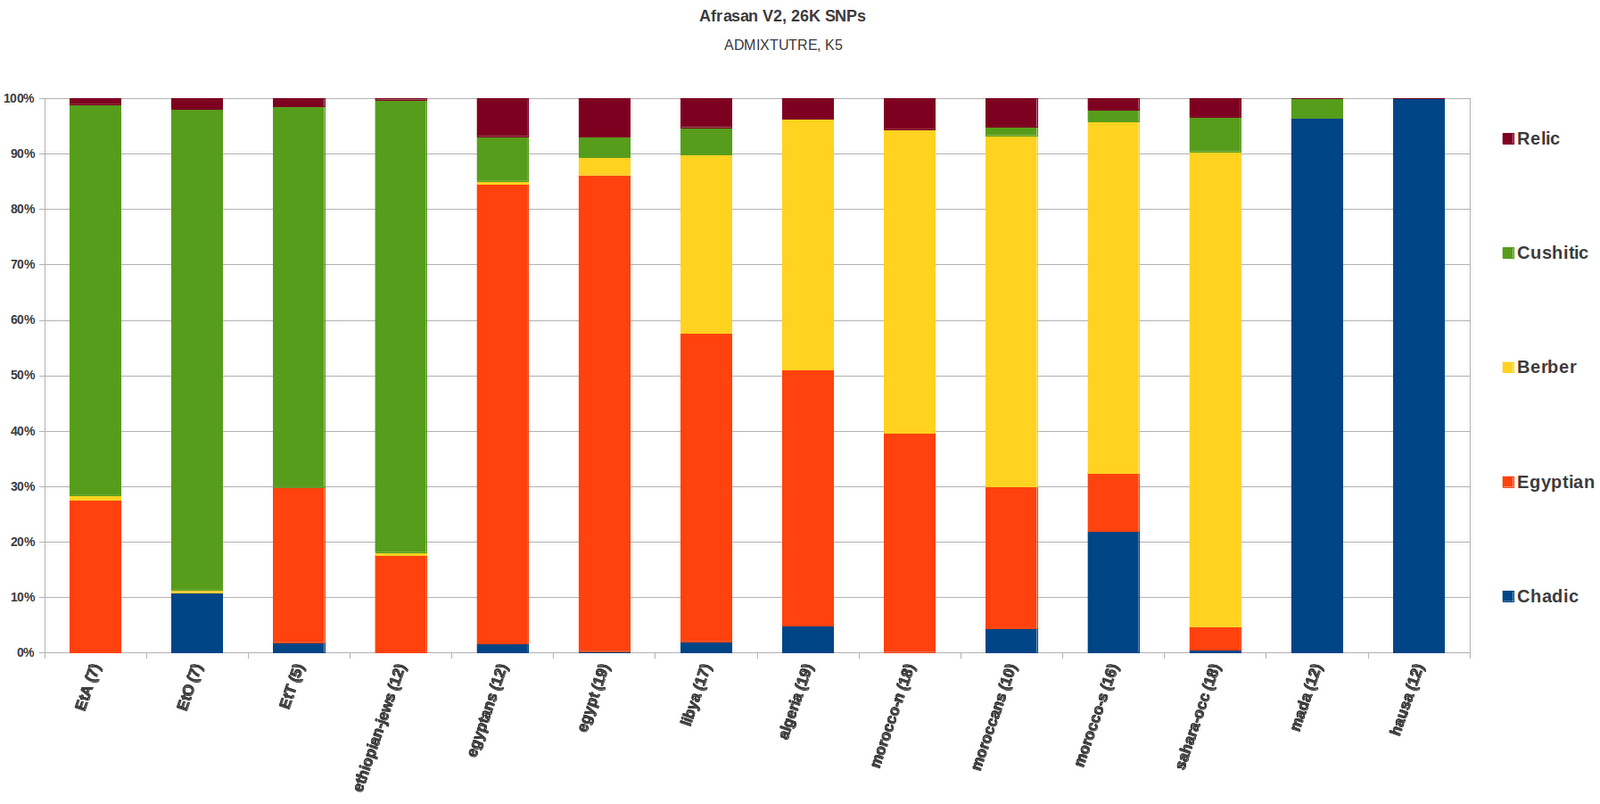
Model Based Analysis.
5 clusters were generated from this dataset using ADMIXTURE, K=5, Unsupervised. A cluster that peaked in the Fulani, one cluster that peaked in the Mozabites, another cluster that peaked in the Sandawe, a fourth cluster that peaked in the Maasai, which I named East African, and a Last cluster that peaked in the Egyptians, which I named North East African, were observed. A PCA for the Fst distances that were generated by ADMIXTURE for these clusters can be seen below.
  
The largest vectorized Fst distance is seen for the Fulani, both for components 1&2, while the East African and Sandawe clusters appear to be close, similar to how the Mozabite and North East African clusters are close.

A standard deviation table (Normalized with N-1) for the 5 clusters generated can be seen below.


The Highest Average Standard Deviation across populations for the five clusters was among the Southern Morrocans and Mozabites (10.61 and 11.7% respectively).

Above are the Median proportions for all five clusters in the dataset.

The Mozabite cluster tapers off in a direction going east from the Northwest of Africa, where it is found at moderate frequencies in Egypt (~10%), the same can be said of the Fulani cluster, i.e tapering off in an eastward direction from Western Africa and found at a moderate (~6%) frequency in the Sandawe. The Sandawe cluster seems to be restricted to East Africa, although relatively high frequencies of it can also be seen in Southern Africa. The East African cluster, which peaks in the Maasai, is observed throughout East, West and Southern Africa. Finally, the North East African cluster merges North Africa with East Africa, for which a major portion can be accounted for with bi-directional Nile Corridor migrations, in addition to populations that used to live in the Sahara at a time when the desert was habitable. Minor, but gradiently significant Extra African input in the formation of the Mozabite and North East African clusters can also not be ruled out.