Showing posts with label Out of Africa. Show all posts

Tuesday, March 17, 2015

New NGS study of the Y DNA

A new Y-DNA study has appeared using Next Generation Sequencing, where ~9 Mb of the Y Chromosome was sequenced for 456 samples (299 of which were new) some preliminary observations are outlined below:

(1) Mutation Rate:

This is the second published study to calibrate the substitution mutation rate for the YDNA based on fossil evidence, to do this, they used a combination of derived mutation rates from 2 separate fossils; the 12.6 KY old Anzick fossil from Montana belonging to haplogroup Q1b and the 4 KY old Saqqaq fossil from Greenland belonging to haplogroup Q2b. The first study, Fu (2014) used the 45 KY old Ust-Ishim fossil from Siberia belonging to haplogroup K(xLT). Interestingly, despite the big difference in age of these fossils of ~ 36 KYA (on average), the derived mutation rates were quite close to each other, with the current study's central estimate only ~8% slower than the rates derived from the Ust-Ishim fossil. The 95% CI bounds for this study were however less tight than the 95% CI bounds of Fu (2014). I have already incorporated these new rates into the TMRCA calculator under Karmin (2015).

(2) Coalescence of Non-African YDNA chromosomes:

The authors report :
....... a cluster of major non-African founder haplogroups in a narrow time interval at 47–52 kya, consistent with a rapid initial colonization model of Eurasia and Oceania after the out-of-Africa bottleneck
Which aligns almost perfectly with the recent find in Manot, Israel of the 49.2 - 60.2 KY old non-African AMH fossil believed of being closely related to the ancestors of all extant non-Africans, i.e. the first OOA migrants.

(3) A "New" E1b1b (E-M215) topology:

The "new" topology of E-M215 they outline below is in-fact over 3 years old, actually, we knew more back then than what they show in this paper today (see here)
E-M215 Karmin (2015)
Compared with what we knew 3 years ago (note: CTS8288 above is equivalent to E-Z830 below):


The unanswered questions with respect to the major topology of E-M215 remain:
  • What is the relationship, if any,  of E-V92 with respect to E-Z827, E-Z830 or E-V68
  • What is the relationship, if any, of E-V6 with respect to E-Z827, E-Z830 or E-V68

A recent bottleneck of Y chromosome diversity coincides with a global change in culture
 

Abstract

It is commonly thought that human genetic diversity in non-African populations was shaped primarily by an out-of-Africa dispersal 50–100 thousand yr ago (kya). Here, we present a study of 456 geographically diverse high-coverage Y chromosome sequences, including 299 newly reported samples. Applying ancient DNA calibration, we date the Y-chromosomal most recent common ancestor (MRCA) in Africa at 254 (95% CI 192–307) kya and detect a cluster of major non-African founder haplogroups in a narrow time interval at 47–52 kya, consistent with a rapid initial colonization model of Eurasia and Oceania after the out-of-Africa bottleneck. In contrast to demographic reconstructions based on mtDNA, we infer a second strong bottleneck in Y-chromosome lineages dating to the last 10 ky. We hypothesize that this bottleneck is caused by cultural changes affecting variance of reproductive success among males.


Link (Closed Access)

Wednesday, January 28, 2015

'Smoking gun' found for the Out of Africa Theory

An Israeli anthropologist, Israel Hershkovitz, claims that he and his team have found the archaeological smoking gun for the Out of Africa theory, a theory which has been genetically reinforced for the past couple of decades,
"This is the smoking gun that confirms what geneticists have been predicting," he said. "We had finds from Africa and from Europe but we were missing the connection between them; it's like finishing a puzzle and finding that a piece is missing: it drives you crazy. This is the missing connection between the older African populations and the later European populations."
The evidence, a 55,000 year old partial skull found in a cave called Manot in Northern Israel, also disqualifies the popular Bab-el-mandeb route that modern humans may have took as they were leaving Africa, and strengthens a Nile valley route according to the same Anthropologist,
Hershkovitz told Haaretz that the presence of modern humans at Manot also supports the idea that Homo sapiens sapiens left Africa through the Nile valley, Sinai and what is today known as Israel,
http://www.haaretz.com/life/archaeology/1.639350

Obviously, a scenario of multiple exits out of Africa, first via Bab-el-mandeb and then via the Nile valley, can not be necessarily discounted by this find.

Levantine cranium from Manot Cave (Israel) foreshadows the first European modern humans

A key event in human evolution is the expansion of modern humans of African origin across Eurasia between 60 and 40 thousand years (kyr) before present (bp), replacing all other forms of hominins1. Owing to the scarcity of human fossils from this period, these ancestors of all present-day non-African modern populations remain largely enigmatic. Here we describe a partial calvaria, recently discovered at Manot Cave (Western Galilee, Israel) and dated to 54.7 ± 5.5 kyr bp (arithmetic mean ± 2 standard deviations) by uranium–thorium dating, that sheds light on this crucial event. The overall shape and discrete morphological features of the Manot 1 calvaria demonstrate that this partial skull is unequivocally modern. It is similar in shape to recent African skulls as well as to European skulls from the Upper Palaeolithic period, but different from most other early anatomically modern humans in the Levant. This suggests that the Manot people could be closely related to the first modern humans who later successfully colonized Europe. Thus, the anatomical features used to support the ‘assimilation model’ in Europe might not have been inherited from European Neanderthals, but rather from earlier Levantine populations. Moreover, at present, Manot 1 is the only modern human specimen to provide evidence that during the Middle to Upper Palaeolithic interface, both modern humans and Neanderthals contemporaneously inhabited the southern Levant, close in time to the likely interbreeding event with Neanderthals2, 3.

Link ( Closed Access) 

Tuesday, August 19, 2014

East African Climate on Hominin Evolution , Archaelogical evidence for African Homo Sapiens Substructure (pre-OOA)

East African climate pulses and early human evolution

Abstract

Current evidence suggests that all of the major events in hominin evolution have occurred in East Africa. Over the last two decades, there has been intensive work undertaken to understand African palaeoclimate and tectonics in order to put together a coherent picture of how the environment of East Africa has varied in the past. The landscape of East Africa has altered dramatically over the last 10 million years. It has changed from a relatively flat, homogenous region covered with mixed tropical forest, to a varied and heterogeneous environment, with mountains over 4 km high and vegetation ranging from desert to cloud forest. The progressive rifting of East Africa has also generated numerous lake basins, which are highly sensitive to changes in the local precipitation-evaporation regime. There is now evidence that the presence of precession-driven, ephemeral deep-water lakes in East Africa were concurrent with major events in hominin evolution. It seems the unusual geology and climate of East Africa created periods of highly variable local climate, which, it has been suggested could have driven hominin speciation, encephalisation and dispersal out of Africa. One example is the significant hominin speciation and brain expansion event at ∼1.8 Ma that seems to have been coeval with the occurrence of highly variable, extensive, deep-water lakes. This complex, climatically very variable setting inspired first the variability selection hypothesis, which was then the basis for the pulsed climate variability hypothesis. The newer of the two suggests that the long-term drying trend in East Africa was punctuated by episodes of short, alternating periods of extreme humidity and aridity. Both hypotheses, together with other key theories of climate-evolution linkages, are discussed in this paper. Though useful the actual evolution mechanisms, which led to early hominins are still unclear and continue to be debated. However, it is clear that an understanding of East African lakes and their palaeoclimate history is required to understand the context within which humans evolved and eventually left East Africa.

Link (Open Access)

Earliest evidence for the structure of Homo sapiens populations in Africa

Abstract

Understanding the structure and variation of Homo sapiens populations in Africa is critical for interpreting multiproxy evidence of their subsequent dispersals into Eurasia. However, there is no consensus on early H. sapiens demographic structure, or its effects on intra-African dispersals. Here, we show how a patchwork of ecological corridors and bottlenecks triggered a successive budding of populations across the Sahara. Using a temporally and spatially explicit palaeoenvironmental model, we found that the Sahara was not uniformly ameliorated between ∼130 and 75 thousand years ago (ka), as has been stated. Model integration with multivariate analyses of corresponding stone tools then revealed several spatially defined technological clusters which correlated with distinct palaeobiomes. Similarities between technological clusters were such that they decreased with distance except where connected by palaeohydrological networks. These results indicate that populations at the Eurasian gateway were strongly structured, which has implications for refining the demographic parameters of dispersals out of Africa.

Link (Closed Access)

Monday, April 21, 2014

Genomic and cranial phenotype data support multiple modern human dispersals from Africa and a southern route into Asia

Significance


Current consensus indicates that modern humans originated from an ancestral African population between ∼100–200 ka. The ensuing dispersal pattern is controversial, yet has important implications for the demographic history and genetic/phenotypic structure of extant human populations. We test for the first time to our knowledge the spatiotemporal dimensions of competing out-of-Africa dispersal models, analyzing in parallel genomic and craniometric data. Our results support an initial dispersal into Asia by a southern route beginning as early as ∼130 ka and a later dispersal into northern Eurasia by ∼50 ka. Our findings indicate that African Pleistocene population structure may account for observed plesiomorphic genetic/phenotypic patterns in extant Australians and Melanesians. They point to an earlier out-of-Africa dispersal than previously hypothesized. 

Abstract


Despite broad consensus on Africa as the main place of origin for anatomically modern humans, their dispersal pattern out of the continent continues to be intensely debated. In extant human populations, the observation of decreasing genetic and phenotypic diversity at increasing distances from sub-Saharan Africa has been interpreted as evidence for a single dispersal, accompanied by a series of founder effects. In such a scenario, modern human genetic and phenotypic variation was primarily generated through successive population bottlenecks and drift during a rapid worldwide expansion out of Africa in the Late Pleistocene. However, recent genetic studies, as well as accumulating archaeological and paleoanthropological evidence, challenge this parsimonious model. They suggest instead a “southern route” dispersal into Asia as early as the late Middle Pleistocene, followed by a separate dispersal into northern Eurasia. Here we test these competing out-of-Africa scenarios by modeling hypothetical geographical migration routes and assessing their correlation with neutral population differentiation, as measured by genetic polymorphisms and cranial shape variables of modern human populations from Africa and Asia. We show that both lines of evidence support a multiple-dispersals model in which Australo-Melanesian populations are relatively isolated descendants of an early dispersal, whereas other Asian populations are descended from, or highly admixed with, members of a subsequent migration event. 

Link (Closed Access) 
 

Tuesday, October 22, 2013

New paper sheds light on the F-series YDNA SNPs

The F-series YDNA SNPs appeared at the end of last year with results from Geno 2.0, now an electronic pre-print at arXiv.org sheds some light on the discovery of these SNPs.

The paper, entitled :  Y Chromosomes of 40% Chinese Are Descendants of Three Neolithic Super-grandfathers, is freely available for download.

Some interesting (relevant to this blog) quotations from the paper follows (in blue) :

To identify major population expansions related to male lineages, we sequenced 78 East Asian Y chromosomes at 3.9 Mbp of the non-recombining region (NRY), discovered >4,000 new SNPs, and identified many new clades.

Nearly all the Y chromosomes outside Africa are derivative at the SNP M168 and belong to any of its three descendent super-haplogroups – DE, C, and F 9,10,15, strongly supporting the out-of-Africa theory. The time of the anatomically modern human’s exodus from Africa has yielded inconsistent results ranging from 39 kya 16, 44 kya 10, 59 kya 17, 68.5 kya 18 to 57.0 – 74.6 kya 19.


This below explains why the F-series SNPs are for the most part found below CT-M168.

we selected 110 males, encompassing the haplogroups O, C, D, N, and Q which are common in East Eurasians, as well as haplogroups J, G, and R which are common in West Eurasians (see Table S1), and sequenced their non-repetitive segments of NRY using a pooling-and-capturing strategy.


Overall ~4,500 base substitutions were identified in all the samples from the whole Y chromosome, in which >4,300 SNPs that has not been publicly named before 2012 (ISOGG etc.). We designated each of these SNP a name beginning with ‘F’ (for Fudan University) (see Table S2). We obtained ~3.90 Mbp of sequences with appropriate quality (at least 1x coverage on >100 out of 110 samples), and identified ~3,600 SNPs in this region.


Table S2 is not available in the PDF file, the link says that all the tables are in a 'separate ancillary file', but such file is also not available, at least not at the time of the publishing of this post, and may become available when the paper is officially published. With out seeing the actual location on the Y chromosome where these SNPs are found it is hard to say how many of them are redundant SNPs relative to the PF and CTS SNPs, and how many of them are truly 'novel'.

Considering that 3.9 Mbp range constitutes only less than half of 10 Mbp non-repetitive region in Y chromosome 7, the time resolution of east Asian Y chromosome phylogeny is expected to be doubled in the near future.


To overcome the factors for uncertainty of mutation rate, a calibration with series of samples of comparable time scales might be used. For the case of mitochondrion, a recent study, in which several C-14 calibrated ancient complete sequences (4 – 40 kya) were incorporated into the tree, made the absolute dates much more convincing 41, and we expect a parallel calibration for the Y chromosome in the near future.


The authors conclude the paper with this paragraph:

Despite of the mutation rate uncertainty, we evaluate our calculation of absolute divergence time as acceptable. Firstly, our out-of-Africa date (54.1 kya) is still within the range of previous estimations (39 – 74.6 kya). Secondly, the out-of-Africa date is similar to the recent estimation of two great mitochondrial expansions outside Africa – M (49.6 kya) and N (58.9 kya) 42. Thirdly, it is not contradictory to the emergence of earliest modern human fossil out of Africa (e.g. ~ 50 kya in Australia) 43.

In the Supplementary Materials/Additional Discussions section they also mention this:

It remained mysterious that how many times the anatomically modern human migrated out of Africa, since that among the three superhaplogrous C, DE and F, Haplogroup F distributes in whole Eurasia, C in Asia and Austronesia, D exclusively in Asia, while D’s brother clade E distribute mainly in Africa 62, so there are two hypotheses, 1) haplogroups D and CF migrated out of Africa separately; 2) the single common ancestor of CF and DE migrated out of Africa followed by a back-migration of E to Africa. From this study, the short interval between CF/DE and C/F divergences weakens the possibility of multiple independent migrations (CF, D, and DE*) out of Africa, and thus supports the latter hypothesis 63 (Fig. S2 a).


Perhaps the only new material they have from this study that may strengthen the hypothesis of an extra-African origin of haplogroup E is, as they mention, the 'short interval' between the common ancestor of CF and DE  and the C/F divergences, however, this 'short interval' is relative to which branch length? They did not compute the interval between the BT common ancestor and the CFDE divergence, in addition, what length of time would be considered too short to disqualify the possibility of multiple independent migrations, and how would this length of time be evaluated? next, what about the cases of DE* found in Nigeria and Guinea-Bissau that they failed to mention here, that is to say, cases found that are neither D or E but are down stream from the YAP+ insertion, how exactly are they to be explained ? 

Either way, putting all these questions aside, let us assume that their proposal is correct, how then would this be reconciled with the last paragraph in the actual paper, where they associate M and N mtDNA haplogroups, with the out of Africa expansion, this would mean that if E back migrated, it would have done so with lineages downstream from mtDNA haplogroups M and N, however, many areas in Africa where E- dominates (except for East and North Africa) have, if not zero, close to zero amounts of mtDNA haplogroups M and N, wouldn't we expect to see at least some traces of the mtDNA counter part for this supposed ancient back migration in YDNA haplogroup E dominant areas of Africa other than the East and the North ? In an otherwise good and all around informative paper, I think the authors may have jumped the gun with this particular speculation, perhaps that is why they stuck it into the supplementary section of the paper and not the actual paper itself, as a testament to the highly speculative nature to their supposition.

Wednesday, July 31, 2013

A summary of interesting recent genetics papers.

I'm taking a break from my Summer break to post a few interesting papers that have come out within the past couple of months.


This paper supports such a notion of continuous gene-flow between Africans and non-Africans since the major Out of Africa event that was precursor to the populating of all continents outside of Africa.
To be sure, such a notion is not new but has been highlighted before by methods used by authors such as Li and Durbin (2011) for instance. Such a notion, is also sufficient to explain the intermediate genetic nature of West Eurasians, I.e between Africans and East Asian/Native Americans, that I have blogged about and demonstrated using ADMIXTURE in the past.


A few quotes from the paper:

"In this paper, we study the length distribution of tracts of identity by state (IBS), which are the gaps between pairwise differences in an alignment of two DNA sequences. These tract lengths contain information about the amount of genetic diversity that existed at various times in the history of a species and can therefore be used to estimate past population sizes. IBS tracts shared between DNA sequences from different populations also contain information about population divergence and past gene flow. By looking at IBS tracts shared within Africans and Europeans, as well as between the two groups, we infer that the two groups diverged in a complex way over more than 40,000 years, exchanging DNA as recently as 12,000 years ago." 

"To illustrate the power of our method, we use it to infer a joint history of Europeans and Africans from the high coverage 1000 Genomes trio parents. Previous analyses agree that Europeans experienced an out-of-Africa bottleneck and recent population growth, but other aspects of the divergence are contested [47]. In one analysis, Li and Durbin separately estimate population histories of Europeans, Asians, and Africans and observe that the African and non-African histories begin to look different from each other about 100,000–120,000 years ago; at the same time, they argue that substantial migration between Africa and Eurasia occurred as recently as 20,000 years ago and that the out-of-Africa bottleneck occurred near the end of the migration period, about 20,000–40,000 years ago. In contrast, Gronau, et al. use a likelihood analysis of many short loci to infer a Eurasian-African split that is recent enough (50 kya) to coincide with the start of the out of Africa bottleneck, detecting no evidence of recent gene flow between Africans and non-Africans [14]. The older Schaffner, et al. demographic model contains no recent European-African gene flow either [48], but Gutenkunst,et al. and Gravel, et al. use SFS data to infer divergence times and gene flow levels that are intermediate between these two extremes [22][49]. We aim to contribute to this discourse by using IBS tract lengths to study the same class of complex demographic models employed by Gutenkunst, et al. and Gronau, et al., models that have only been previously used to study allele frequencies and short haplotypes that are assumed not to recombine. Our method is the first to use these models in conjunction with haplotype-sharing information similar to what is used by the PSMC and other coalescent HMMs, fitting complex, high-resolution demographic models to an equally high-resolution summary of genetic data."

"We estimate that the European-African divergence occurred 55 kya and that gene flow continued until 13 kya. About 5.8% of European genetic material is derived from a ghost population that diverged 420 kya from the ancestors of modern humans. The out-of-Africa bottleneck period, where the European effective population size is only 1,530, lasts until 5.9 kya."

"Our inferred human history mirrors several controversial features of the history inferred by Li and Durbin from whole genome sequence data: a post-divergence African population size reduction, a sustained period of gene flow between Europeans and Yorubans, and a “bump” period when the ancestral human population size increased and then decreased again. Unlike Li and Durbin, we do not infer that either population increased in size between 30 and 100 kya. Li and Durbin postulate that this size increase might reflect admixture between the two populations rather than a true increase in effective population size; since our method is able to model this gene flow directly, it makes sense that no size increase is necessary to fit the data. In contrast, it is possible that the size increase we infer between 240 kya and 480 kya is a signature of gene flow among ancestral hominids."

"Our estimated divergence time of 55 kya is very close to estimates published by Gravel, et al.and Gronau, et al., who use very different methods but similar estimated mutation rates to the  per site per generation that we use in this paper. However, recent studies of de novo mutation in trios have shown that the mutation rate may be closer to  per site per generation [51][55][56]. We would estimate older divergence and gene flow times (perhaps  times older) if we used the lower, more recently estimated mutation rate. This is because the lengths of the longest IBS tracts shared between populations should be approximately exponentially distributed with decay rate ."


This paper discusses some points, rather the lack of evidence, that makes a pre-toba migration of modern humans outside of Africa almost impossible to reconcile with currently available evidence.

A few quotes from the paper:

"There are currently two sharply conflicting models for the earliest modern human colonization of South Asia, with radically different implications for the interpretation of the associated genetic and archaeological evidence (Fig. 1). The first is that modern humans arrived ∼50–60 ka, as part of a generalized Eurasian dispersal of anatomically modern humans, which spread (initially as a very small group) from a region of eastern Africa across the mouth of the Red Sea and expanded rapidly around the coastlines of southern and Southeast Asia, to reach Australia by ∼45–50 ka (7–10, 14–18) (Fig. 2). The second, more recently proposed view, is that there was a much earlier dispersal of modern humans from Africa sometime before 74 ka (and conceivably as early as 120–130ka), reaching southern Asia before the time of the volcanic “supereruption” of Mount Toba in Sumatra (the largest volcanic eruption of the past 2 million y) at ∼74 ka (1–6)."
"We find no evidence, either genetic or archaeological, for a very early modern human colonization of South Asia, before the Toba eruption. All of the available evidence supports a much later colonization beginning ∼50–55 ka, carrying mitochondrial L3 and Y chromosome C, D, and F lineages from eastern Africa, along with the Howiesons Poort-like microlithic technologies (see above and Genetics and Archaeology). We see no reason to believe that the initial modern human colonization of South and Southeast Asia was distinct from the process that is now well documented for effectively all of the other regions of Eurasia from ∼60 ka onward, even if the technological associations of these expanding populations differed (most probably for environmental reasons) between the eastern and northwestern ranges of the geographical dispersal routes."

"The archaeological evidence initially advanced to support an earlier (pre-Toba) dispersal of African-derived populations to southern Asia has since been withdrawn by the author responsible for the original lithic analyses, who now suggests that they are most likely “the work of an unidentified population of archaic people” (ref. 11, p. 26). Meanwhile, the genetic evidence outlined earlier indicates that any populations dispersing from Africa before 74 ka would predate the emergence of the mtDNA L3 haplogroup, the source for all known, extant maternal lineages in Eurasia (8, 28) (Fig. 5). The size of the mtDNA database is very substantial: currently there are almost 13,000 complete non-African mtDNA genomes available, not one of which is pre-L3."


This paper, written by a geneaolgoical community member, has made an impressive effort at creating and automating a comprehensive method to pylogenetically classify Geno 2.0 YDNA SNPs. Details of the algorithm are not available:

"To illustrate this, the author has used this Y-tree clade predictor (using the latest ISOGG tree as a basis for comparison) to classify over 1650 sets of publicly accessible Geno 2.0 Y-SNP calls. This information was then used as an input into another algorithm designed by the author – an algorithm developed to automate the construction of a phylogenetic Y-tree, while overcoming the challenges identified above. The technical details of this process will remain proprietary for the time being."


Saturday, July 7, 2012

The World At K=2


The most basic Autosomal genetic division of the world is between Africans and Out of Africans (OOA), this is not only seen on global PCA or MDS maps , where the first PC separates Africans from non Africans, but can also be observed with model based statistical (Bayesian) Analysis as well, where the first model iteration, i.e. K=2 distinguishes Africans from non-Africans.
Here, I present (for reference) the full ADMIXTURE, K=2 results for a global dataset of 2,967 individuals from around the world, sampled for 16,595 SNPs with a total genotyping rate of 99.6%.

The results are arranged from the highest median African % to the lowest.

Tuesday, May 8, 2012

A Novel Solution For Dating The Origin Of Language.


A paper published by C. Perreault and S. Mathew in PLOS ONE outlines a new method of dating the origin of language in Africa, and therefore the origin of language of all humans.

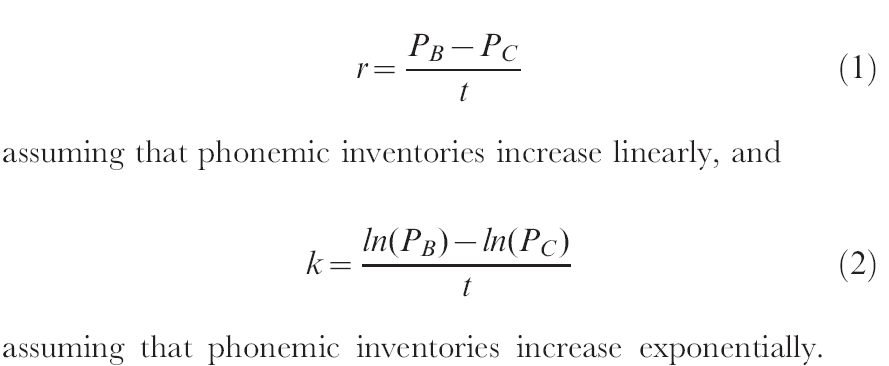
The method starts by first estimating a linear (r) and exponential (k) rate at which phonemic diversity increases with time using this formula:

 
Where t is the date of colonization and PB and PC are the current phonemic diversity of populations B and C, where such populations are hypothesized as follows:

"consider the hypothetical case of two small populations, B and C, that dispersed from the same parent population, A, t years ago (Figure 1). Suppose that B and C are similar in size so that they both experience approximately the same loss in phonemic diversity due to the founder effect. Now, suppose that population B colonizes a large continental territory and subsequently expands and diversifies linguistically [66,67]. In contrast, population C settles on a small island that does not allow for population expansion and language diversification. Because of the differences between the regions colonized by B and C, population B will accumulate phonemes at a faster rate than population C. Furthermore, if population C evolves on a sufficiently small island and remains isolated for most of its history, then the rate of phoneme accumulation in C will be low, and its phonemic diversity will remain approximately stable through time. Consequently, the present-day difference between the phonemic diversity of B and C can be attributed to the new phonemes accumulated within population B. Thus, the current phonemic diversity of population C has remained through time a good approximation of the original phonemic diversity of population B."

They then use the case of Southeast Asia (Pop B) and the Andaman Islands (Pop C) to estimate the linear and exponential phonemic diversity increase rates. The date of colonization, t, of these geographic zones is set between 45 -65 KYA, the phonemic diversity of Pop B and and Pop C were retrieved from the UCLA Phonological Segment Inventory Database (UPSID) and customized with the following assumptions:

"We estimate PB by taking the average phonemic inventory size of the languages in Mainland Southeast Asia. Assuming an eastward, coastal migration route, we have excluded the Asian languages that are located west of Andaman Islands (such as the languages from India and Nepal), as well as those spoken in Myanmar and the Malay Peninsula, because they could have served as departure points for the colonization of Andaman Islands (Figure 2). The 20 languages retained in our sample are thus those spoken in Cambodia, Vietnam, Laos and Southwest China (Table 1). The average phonemic diversity of the resulting sample is 41.21+2.74 (errors represent one standard error). Great Andamanese (ISO 639-2:apq) is the only Andamanese language to appear in UPSID. Its phonemic diversity, 24, serves as our estimate of PC."

Thus, with the above values the linear and exponential rate of phonemic diversity were estimated to be between 0.26-0.38 and 83.17-120.14 respectively for a date of colonization of between 45-65 KYA, where the lower rate of increase in phonemic diversity corresponds to the upper bound of the date of colonization and the higher rate corresponds to the lower bound of the date of colonization.

Next, they proceed to use the rates from above to estimate t0 or “the time it would take for a language to acquire the phonemic diversity observed today in African languages” using the following formula:


Where Pinitial is the number of phonemes that the first human languages started with, and assumed in one case to be 11, or the smallest phonemic inventory ever observed and for another case, 29, or just a median phonemic diversity. PAfrica is the average of the phonemic diversity of click speaking Africans, as they are the populations that are thought to have lost the least amount of phonemes due to founder effect, where as all the remaining macro language groups of Africa; Afroasiatic, Nhilo Sahran and Niger Kordofanian are known to have all undergone serious geographic expansions. The authors substantiate this assumption by stating:

"This idea is consistent with the fact that the average phonemic diversity of Afro-Asiatic, Niger-Congo and Nilo-Saharan languages is 36, 33, and 29 respectively, while the average phonemic diversity of African languages outside these families is 75."

Using a few other criteria they therefore estimate PAfrica to be 71.4

Thus with the above values, the results of t0 for the two different assumed values of Pinitial were calculated for the linear and exponential rate of phonemic diversity increase as follows:


The authors come to the following conclusion from their analysis:

"Our analysis suggests that language appears early in the history of our species. It does not support the idea that language is a recent adaptation that could have sparked the colonization of the globe by our species about 50 kya [1,91]. Rather, our result is consistent with the archaeological evidence suggesting that human behavior became increasingly complex during the Middle Stone Age (MSA) in Africa, sometime between 350– 150 kya [92–100]. However, we cannot rule out the possibility that other linguistic adaptations, that are independent of phonemic evolution, arose later and triggered the out-of-Africa expansion."

More details from the paper, which is open access, can be found here.

Thursday, April 5, 2012

A ‘‘Copernican’’ Reassessment of the Human Mitochondrial DNA Tree from its Root

Mutational events along the human mtDNA phylogeny are traditionally identified relative to the revised Cambridge Reference Sequence, a contemporary European sequence published in 1981. This historical choice is a continuous source of inconsistencies, misinterpretations, and errors in medical, forensic, and population genetic studies. Here, after having refined the human mtDNA phylogeny to an unprecedented level by adding information from 8,216 modern mitogenomes, we propose switching the reference to a Reconstructed Sapiens Reference Sequence, which was identified by considering all available mitogenomes from Homo neanderthalensis. This ‘‘Copernican’’ reassessment of the human mtDNA tree from its deepest root should resolve previous problems and will have a substantial practical and educational influence on the scientific and public perception of human evolution by clarifying the core principles of common ancestry for extant descendants.

Source (Open Access)

Some quotes and figures from the paper: 

"Supported by a consensus of many colleagues and after a few years of hesitation, we have reached the conclusion that on the verge of the deep-sequencing revolution (47,55) when perhaps tens of thousands of additional complete mtDNA sequences are expected to be generated over the next few years, the principal change we suggest cannot be postponed any longer: an ancestral rather than a ‘‘phylogenetically peripheral’’ and modern mitogenome from Europe should serve as the epicenter of the human mtDNA reference system."


"Interestingly, the ranges of substitution counts within haplogroups M and N, which are hallmarks of the relatively recent out-of-Africa exodus of humans, are also very large. For example, within M there are two mitogenomes with 43 substitutions (in M30a and M44) and two mitogenomes with as many as 71 substitutions (in M2b1b and M7b3a). This is especially striking because the path from the RSRS to the root of M already contains 39 substitutions. Hence, the difference between the M root and its M44 descendant is only four substitutions (two in the coding region and two in the control region) as compared to 32 substitutions in the M2b1b and M7b3a mitogenomes. These observations raise the possibility that the tree in general, and haplogroup M in particular, might not adhere uniformly to the assumed molecular clock, under which substitutions occur at a fixed rate on all branches of the tree over time."

Some inferred dates of interest (from the supplemental file):
L3 : 67,262 (SD 4,434)
        M : 49,590 (SD 1,824)
              M1'20'51 : 47,641 (SD 2,851)
                                 M1 : 23,680 (SD 4,378)
                                          M1a : 19,183 (SD 3,226)
                                                    M1a1 : 12,910 (SD 3,341)
        N : 58,860 (SD 2,352)
              N1'5 : 56,547 (SD 4,705)
                         N1 : 51,643 (SD 5,640)
                                 N1a : 18,118 (SD 5,247)


Others;
R0a1 :   20,766 (SD 5,754)
U6a1 : 20,133 (SD 4,941)
J1 : 26,935 (SD 5,273)
T : 25,149 (SD 4,668)
K : 26,682 (SD 4,339)


Wednesday, March 21, 2012

A Supervised Global ADMIXTURE Run


A supervised ADMIXTURE run, assumes that certain populations within a given dataset are 100% of a certain ancestry, so for instance, given one wants to run ADMIXTURE at K=10 in supervised mode, then 10 different populations that are assumed to come from the 10 putative ancestral clusters that the software will infer, or rather will be forced to infer, must be manually selected.

I wanted to explore this type of a run on a global basis and purposefully select populations that not only may form their own clusters in an unsupervised run, but are also thought to be within the 'trunk', bifurcation 'nodes' and end 'branches' of the ancestral 'tree' of all people.
  
The basis of this run is the global dataset than can be downloaded in PLINK format from here. The dataset, a superset of the African dataset that I have been thus far utilizing, contains 3,970 individuals from around the world typed at 27,022 genome-wide SNPs.
A 3 dimensional, as well as a dim1 vs dim2, MDS plot labelled according to the median coordinates of the population groups for this dataset can be seen below:


The general structure of a globally spread PCA/MDS plot is well known and understood, the first principal component, describing the highest variation of all the components, separates Africans from non-Africans, while the second principal component separates West Asians/Europeans from East Asians, Oceanians and Native Americans. The 3rd principal component can be however shaky, in the plot above it separates Native Americans from the rest, however other sources have shown that the 3rd principal component in a global PCA separates divergent hunter gatherers (like the Hadza, Sandawe, San and Pygmies) from every body else, perhaps a 3-D PCA generated from full genome scans will put this to rest once and for all.

Monday, March 12, 2012

TreeMix analysis on the African Dataset


Thanks to a commenter going by the moniker 'Eze', who notified me the other day of a new program called Treemix, in which it infers “patterns of population splitting and mixing from genome-wide allele frequency data”, I had a chance to give it a try on the Intra-African Dataset that I have described previously.

After converting the input file into the desired format, I decided to play with several of its functionalities to become familiar with it,
 
1) Default Maximum Likelihood (ML) Tree,


2) Default ML graph with 4 assumed migrations,


 3) ML graph rooted with the San-nb,

  
4) ML graph with 4 migrations and rooted with the San-nb.

A remaining option of the software that I have not as yet tried is that which groups SNPs together to account for linkage disequilibrium. 

Other than that, the results are quite as expected, the North Africans are shown in both the default and rooted trees, but especially with the San-n rooted tree, as a branch of East Africans, and where East Africans in turn are seen as a branch of other Africans, consistent with evidence from uni-parental markers, as well as published papers, for an East African genesis of Eurasians, of which North-Africans can be used as a proxy for this particular Dataset.

The 4 inferred migrations in order of decreasing edges were;

-(Biaka Pygmy, Ancestral Sotho/tswana) → Sandawe, Migration edge:0.457032; likely an old hunter gatherers link. This was noted by Tishkoff (2009) : “These results suggest the possibility that the SAK, Hadza, Sandawe, and Pygmy populations are remnants of an historically more widespread proto-Khoesan- Pygmy population of hunter-gatherers.”

-(!kung,Ancestral to Biaka and Mbuti Pygmies) → Hadza,
Migration edge:0.44087; potentially another early hunter gatherers link.

-Ethiopian Jews → San,
Migration edge:0.188914; this could be a relic of early hunter-gatherer connections with Ethiopia (See: Ethiopians and Khoisan share the deepest clades of the human Y-chromosome phylogeny.) Another possible connection for this could be the migration of YDNA E1b1b1b2b (E-M293) carriers from Eastern Africa to Southern Africa within the past few millennia.

-Mbuti Pygmy → Alur,
Migration edge:0.140627; this was also picked up by the ADMIXTURE analysis, where the Alur had significant amounts of Mbuti and Biaka pygmy components.

Further reading on the details behind the software featured in this post, TreeMix, can be found here: http://hdl.handle.net/10101/npre.2012.6956.1.


UPDATE: Run another one again rooted with the SAN from Namibia and 10 migrations assumed and got the following results, left column is Migration edge weight

0.586693 luhya →hema,hadza
0.508001 egyptans → EtA
0.504407 egyptans → EtT
0.442291 egyptans → Ethiopian-jews
0.432858 moroccans → fulani
0.27746 mbutipygmy,pygmy → sandawe
0.203223 mbutipygmy,pygmy → hadza
0.156929 egyptans → maasai
0.154406 moroccans → san
0.129901 pygmy → alur


Some of the results from the previous 4 assumed migrations run disappeared, it is not clear if migrations inferred from a lower m assumption are more statistically significant than those inferred from higher m assumptions. In general, this newer run resembles more of the K10 ADMIXTURE run, however there are some obscure differences, for instance, while it picked up a North to East African migration in the EtA, EtT and EtJ samples, it skipped the EtO samples and then picked up the same migration pattern in the maasai samples, whom had a lower 'North-African' component in the K10 ADMIXTURE run than the EtO samples. My take on this is that the program is not yet sophisticated enough to accommodate for bidirectional migrations that have happened for thousands of years, like the ones that have taken place between East and North Africa for instance. Indeed the authors of the software do list the following pertinent point as one of their assumptions:

"We also have modeled migration between populations as occurring at single, instantaneous time points."

and

"This model will work best when gene flow between populations is restricted to a relatively short time period. The relevance of this assumption will depend on the species and the populations considered."

UPDATE2: Residual plot for 10 migrations rooted with the San-nb.

Saturday, January 28, 2012

Updates on the Human Journey Project: Spencer Wells


Notes:
  • Estimates YDNA TMRCA to 60 KYA, this is in conflict with Cruciani et. al (2011) :"A Revised Root for the Human Y Chromosomal Phylogenetic Tree: The Origin of Patrilineal Diversity in Africa", where the root of the MSY was estimated to 142 KYA, although Dr. Wells may be talking about CT-M168, it is not clear enough from the video.
  • So far the project has sampled over 1000 different populations around the world, with about 75,000 samples collected from 'indigenous' people, and an additional 415,000 samples from the public who purchased kits.
  • Climate appearing to be a 'key motivator' of migrations.
  • Europe colonized from the south at the end of the ice age from two different directions/sources that acted as a 'Refugium' during the ice age, a Franco-Cantabrian refugium in the southwest of Europe and another refugium in the Southeast (around the Balkans).
  • 'Middle Easterners' from the 'northern area of the Fertile crescent' literally replaced Mesolithic Europeans during the Neolithic revolution, he points to ancient DNA evidence for this.

Thursday, January 19, 2012

The Mother of Mothers !


It has been well known for about 20 years now that the mother of all Non-Africans, and indeed a lot of Africans, was an East African woman, in more recent nomenclature this woman has been called L3, so what do geneticists recently say about this woman, mother to greater than six and a half billion people on Earth, including many who still inhabit her original homeland?

The most recent study conducted to uncover the story behind L3 and her compatriots was one from the end of last year entitled “The Expansion of mtDNA Haplogroup L3 within and out of Africa”. 

This important study capped the timing of the out of Africa migrations, which all contemporary men and women outside of Africa are descended from, to no earlier than Seventy Thousand Years Ago.

The basis for this reasoning can be found in this paragraph from the text:

The time window for the out-of-Africa migration on the basis of mtDNA lies between the emergence of haplogroup L3 in Eastern Africa and its derivative non-African haplogroups M and N, which most likely arose during the departure or outside Africa (Richards et al. 2006).”

Meaning, since all Non-Africans are descended from this woman, the timing of the out of Africa migration can not be any older than when she lived and can not be any younger than when here descendant daughters M and N lived, although there still remains a possibility that M and N emerged in Africa, albeit increasingly unlikely.

The expansion of L3 however has been linked in the past to not only the Out of Africa expansion but also Expansions within Africa, generally in association with two different episodes:
  1. With the spread of Pastoralism in the Sahara of the early Holocene
  2.  With the Bantu Expansion/s
To this end, the samples for this study were said to come from:

We collected a total of 102 Sudanese, 77 Ethiopian (both emigrants in Dubai), and 148 Somali (refugees in Yemen) samples, belonging to unrelated individuals, who gave appropriate informed consent for their biological samples to be used for mtDNA characterization.”

Where a set of identified L3 lineages from above (plus other previous papers) were then selected for complete mtDNA sequencing:

We selected for complete mtDNA sequencing a total of 21 Sudanese, 16 Ethiopian, and 20 Somali samples chosen from the sequences characterized in this work, and 11 from Chad and 2 from Soqotra belonging to haplogroup L3 from data sets published previously (Cerny´ et al. 2007; Cerny´, Pereira, et al. 2009).”

So what were the main results of the extensive statistical analysis done on this lineage?

A) Complete mtDNA phylogeny for Haplogroup L3:

 
Schematic tree of haplogroup L3. Age estimates are respectively rho estimates from the complete mtDNA genome (black font), rho estimates using the synonymous clock (gray font), and ML estimates using the complete mtDNA genome (black font underlined). Color scheme for each clade indicates the probable geographic origin. Haplogroups M and N are indicated and age estimates are according to Soares et al. (2009). MSA refers to Middle Stone Age and LSA to Late Stone Age.

B) Reaffirmation of what was known in the past with respect to the origins of L3:

L3 most likely had an origin in Eastern Africa (Torroni et al. 2006). This is supported by the presence of all major branches, with L3a and L3h virtually specific to the region and L3eikx and the L3f haplogroups having a probable origin there as well, whereas for L3bcd, the region of origin is less clear and will be discussed in more detail below. The other two main branches of L3, M and N, exist only outside Africa, except for some back-migrations into Africa around 50–30 ka in the form of haplogroups U6 and M1 (Olivieri et al. 2006; Pereira et al. 2010) and some more recent intrusions (Cherni et al. 2009; Ottoni et al. 2010). Since there is strong evidence that the dispersal out of Africa was via the Horn, soon after L3 arose (Macaulay et al. 2005), the distribution of M and N also points to Eastern Africa as the center of gravity for L3.”

C) Temporal analysis of the sampled L3 lineages with origins bracketed within 60 – 70 thousand years ago:
 
"It seems likely that L3 dates somewhere between 60 and 70 ka, as the TMRCA estimates vary between 58.9 ka (using rho and the complete genome) and 70.2 (using ML), with the synonymous clock providing a value between the two (63.1 ka). We checked if the L3 tree rejected a strict molecular clock by running the ML analysis without stipulating a molecular clock and performing a likelihood ratio test that clearly did not reject the clock hypothesis (P 5 0.9899). These results led us to consider an age of 65 ka (varying between 60 and 70 ka in the 95% percentile) in the internal calibration of BEAST, as there was no other reliable calibration point we could use. The ages using the complete genome and the synonymous clock were 1.04 and 0.97 times the BEAST estimates, respectively, indicating that the BSPs were calculated using a similar rate to the other analyses, as we intended.”

D) Identification of 3 main episodes of population growth/expansion within Africa:
i) Approximately 40 thousand years ago corresponding with the emergence of the various intra-African subclades of L3.
ii) Around the Holocene, associated mainly with L3bd and L3e (Central Africa)
iii) The largest increase of the expansions detected around four thousand years ago and most pronounced in the Central African Bayesian Skyline Plots.

E) L3f and L3eikx both implied to have an origin in Eastern Africa. Where L3f was carried into the Sahel and Central Africa, with L3f3 specifically expanding into the Sahel 8 to 9 thousand years ago.

F) The most frequent clade of L3, i.e. L3e implied to have an origin in Central/Western Africa. With Eastern African L3e discounted as more recent introgression from there.
 
G) An ambiguous interpretation for the origin of L3bcd, a tentative east African origin is however suggested:

L3bcd has three main subclades, with L3b and L3d tentatively united by a transition at control region position 16124 to form the putative subclade L3bd. The great age of L3bcd and its wide distribution across Africa makes phylogeographic inferences difficult. Furthermore, L3c is extremely rare: Only two samples have been detected so far, one in Eastern Africa and the other in the Near East. This might echo an early origin of L3bcd in Eastern Africa, before moving west, but its rarity makes this conclusion extremely tentative. In a scenario of an early origin of L3bcd in Eastern Africa, M and N would be the only subclades of L3 to have most likely originated outside of Eastern Africa (although an origin in Eastern Africa remains possible: Richards et al. 2006).

H) A virtual exclusion of a scenario in which the ancestors of contemporary people outside of Africa migrated out of Africa before the eruption of Toba.

I) And finally the most interesting part of this paper's conclusion, a unified demographic process that led to both the out-of-Africa and within Africa primary expansion of L3:

Furthermore, since the age of the M and N Eurasian founders of ;50 to 65 ka (Soares et al. 2009) is close to the age of their ancestral L3 clade in Africa, the out of-Africa dispersal may have been of a piece with the initial diversification and expansion of L3, so that the L3 expansions in Eastern Africa and the exit of modern humans from Africa;60 ka were all part of a single demographic process.

It seems likely that the moister climate after;70 ka in Eastern Africa allowed dramatic human population growth (Scholz et al. 2007), perhaps associated with improved hunting, marine exploitation, exchange networks, and possibly even plant food management strategies as suggested by Mellars (2006). This generated the oldest major signal of expansion in the human mtDNA tree, the radiation of L3, leading rapidly to the spread of H. sapiens toward the rest of the world. It is worth stressing that this signal is not reflected in other mtDNA lineages at this time (Behar et al. 2008). Within Africa, the Pleistocene migrations detected in the L3 pool were responsible for the introduction of L3bd and L3e into Central Africa in the period between 60 and 35 ka (fig. 5A), but none reached Southern Africa at that time.”

Interestingly, the previous explanations that the Out of Africa expansion of modern humans being linked with behavioral modern thinking is largely dismissed by these authors for the sole explanation of Environmental factors, their main reasoning being that there is evidence for behavioral modernity of humans in Africa (Both in South and North Africa) long before their proposed timing of the OOA migrations.

Thus, as suggested by Basell (2008), the demographic expansions that led to the first successful dispersal out of Africa seem better explained by the play of palaeoenvironmental forces than by recourse to the advantages of ‘‘modernity." 

More interesting figures from the paper:


Frequency maps based on HVS-I data for haplogroups L3a, L3i, L3h, and L3x combined (A), L3f (B), L3e (C), L3b (D), and L3d (E).”


Outline of the main dispersals detected in this work during the Pleistocene (A) and the Holocene (B).”


 ** Sketches on top of page depicting contemporary women that still live in the putative land of  L3's origin. Credit goes to Ethiopian Artist Adis Gebru and taken from this blog.