Find below a comprehensive list for all central TMRCA estimates calculated from the Plaster thesis for 6 UEPs (look at this post under Interactive Chart of Figure 3.2 for the frequencies of the UEPs). P*(x R1a) & Y*(x BT,A3b2) are not included due to their minimal frequency and very sporadic distribution.
There were a total of 5,756 haplotypes reported with the paper for the markers DYS19, DYS388, DYS390, DYS391, DYS392 and DYS393. 30 of those haplotypes belonged to P*(x R1a) & Y*(x BT,A3b2), leaving a total of 5,726 haplotypes. These remaining haplotypes, were then categorized with the criteria of Cultural ID + Generic Language Group* + UEP, any group of haplotypes that conformed to this criteria with N >1 and with a coalescent not equal to 0 (meaning non-identical haplotypes) were processed for their TMRCA and reported, accounting for 5,668 or 98% of the total haplotypes reported for the paper.
The tables are ordered according to the frequencies of the tested UEPs in Ethiopia, i.e. E*(x E1b1a), 3985 Haplotypes > J, 689 Haplotypes > A3b2, 601 Haplotypes > K*(xL,N1c,O2b,P) , 154 Haplotypes > BT*(xDE,JT), 193 Haplotypes and E1b1a7, 46 Haplotypes .
Note that both the mean TMRCA's for Zhivotovsky (Z-TMRCA) and the pedigree rates (P-TMRCA), some times also known as germline rates, are in units of generations, the suitable length of a generation for the Z-TMRCA is 25 years, while for the P-TMRCA it may range from 28 to 33 years.
If detail of the TMRCA analysis for any of the populations listed below maybe required, go to the table here, and upload the necessary file into the Y TMRCA calculator and filter for the specific population in question.
Showing posts with label Semitic. Show all posts
Showing posts with label Semitic. Show all posts
Friday, February 14, 2014

Tuesday, May 7, 2013
Analyzing YDNA A-M13 lineages in Ethiopian linguistic groups
Similar to the previous analysis of J lineages found in Ethiopia from the Plaster paper, the other prevalent lineage in Ethiopia, A-M13 (formerly known also as A3b2), is also analyzed below. A total of 616 A-M13 lineages were reported in the study, of which ~32% were classified as Semitic speakers, ~40% as Cushitic speakers, ~17% as Omotic speakers and the remainder within the Nilo-Saharan speaking macro-phylum.
Wednesday, May 1, 2013
Analyzing YDNA J lineages in Ethiopian linguistic groups
The extensive YDNA dataset found in the Plaster paper has a total of 691 YDNA lineages that belong to haplogroup J, although there is no more detailed SNP resolution reported for most of these lineages, it is safe to assume, from previous data on Ethiopia, that a vast majority of them would belong to J1-M267. There is a limited set of STR data that accompanies these lineages as well, namely only for the markers; 19, 388, 390, 391, 392 and 393.
According to the report, J lineages are proportionally found higher in Semitic speakers in Ethiopia, ~21% ,followed by Omotic speakers at ~ 12% and Cushitic speakers at ~ 8%. Out of the 691 YDNA J lineages reported, 259 were Semitic speakers, 266 spoke some type of Omotic language and most of the remainder spoke Cushitic languages.
According to the report, J lineages are proportionally found higher in Semitic speakers in Ethiopia, ~21% ,followed by Omotic speakers at ~ 12% and Cushitic speakers at ~ 8%. Out of the 691 YDNA J lineages reported, 259 were Semitic speakers, 266 spoke some type of Omotic language and most of the remainder spoke Cushitic languages.
Monday, February 4, 2013
A speculative superimposition of E-M35 variants onto Afroasiatic.
Here is a speculative superimposition of the variants of YDNA E-M215/M35 (E1b1b/1) onto an Afroasiatic internal classification, Lionel Bender's (1997) classification.

The red question marks represent a less unsure fit.

Thursday, March 8, 2012
Afrasans in a Genome-Wide context.
A subset of the Intra-African dataset I
have includes Afrasans, or Afroasiatic speakers. Afroasiatic is
typically divided into 6 major categories or groups; Semitic, Berber,
Egyptian, Chadic, Cushitic and Omotic. A 7th, but nearly extinct group, known
as Ongota is contentious, but is by some included as its own branch
within the Afroasiatic phylum. All of these Language groups, with
the exception of Semitic, are exclusively found in Africa. The 211
Afrasan samples in the dataset belong to 4 or 5 of those groups mentioned,
depending on how one accounts for any language shifts (that is shifts
within the wider Afrasan phylum) that might have occurred. A rough
table is shown below associating the 211 samples with current, and in
some cases previously spoken language or language groups of
Afroasiatic.

In general, Afroasiatic is thought to
have emerged somewhere in the North Eastern section of Africa,
anywhere from Ethiopia to Southern Egypt, in the genetic (Autosomal)
sense, this area can perhaps be viewed as where
such populations inhabiting that area in Africa, lie along a diagonal axis of the C1 vs C3 Intra- African MDSplot (at ~
34°
from the horizontal), as highlighted below:
MDS plots
After extracting the 211 AA speaking
samples from the 1065 sample African Dataset, I performed an MDS Analysis on
it as seen below.


Component 1 separates
Berber/Semitic/Egyptian speakers from Chadic speakers, with Ethiopian
Semitic/Cushitic speakers plotting somewhere in between, but closer
to the former in this separation. Component 2, separates Ethiopians+Egyptians from the rest.

Component 3 Separates the Mozabites
from the Rest, with Ethiopians again retaining an intermediate
position.
Model Based Analysis
The Logical value for a K selection
would be 6, i.e. equivalent to the number of known Afroasiatic
subgroups, however, since Omotic speakers are not present in the
Dataset, I went ahead and run a K=5 unsupervised ADMIXTURE Analysis
for the Afrasan Dataset.
The K=5 ADMIXTURE run produced the
following FST distances,

The biggest separation for both Axis is
for the cluster I nicknamed Cushitic, while the Berber, Semitic and
Mozabite clusters appear pretty close, with the Mozabites looking a
bit isolated.
The Median proportions for the clusters
can be seen below.

The fact that the mozbites formed their
own cluster, is intriguing, although one would suspect that
inbreeding may play a role, since it can also be seen how the Mozabites
cluster away from other North Africans in the 3D MDS plot, almost
forming their own group.
Therefore, to see what this analysis would
look like without the Mozabites, I took all 27 of them out, leaving
me with 184 AA speaking samples.
I repeated the same analysis as above on the
newer Dataset.
MDS Plots


Components 1 and 2 behaved the same way
as when the Mozabites were included, Component 3 however, without the
Mozabites, separates Berber and Cushitic speakers from the rest to almost the same
degree, unlike when the Mozabites were included.
Model Based Analysis

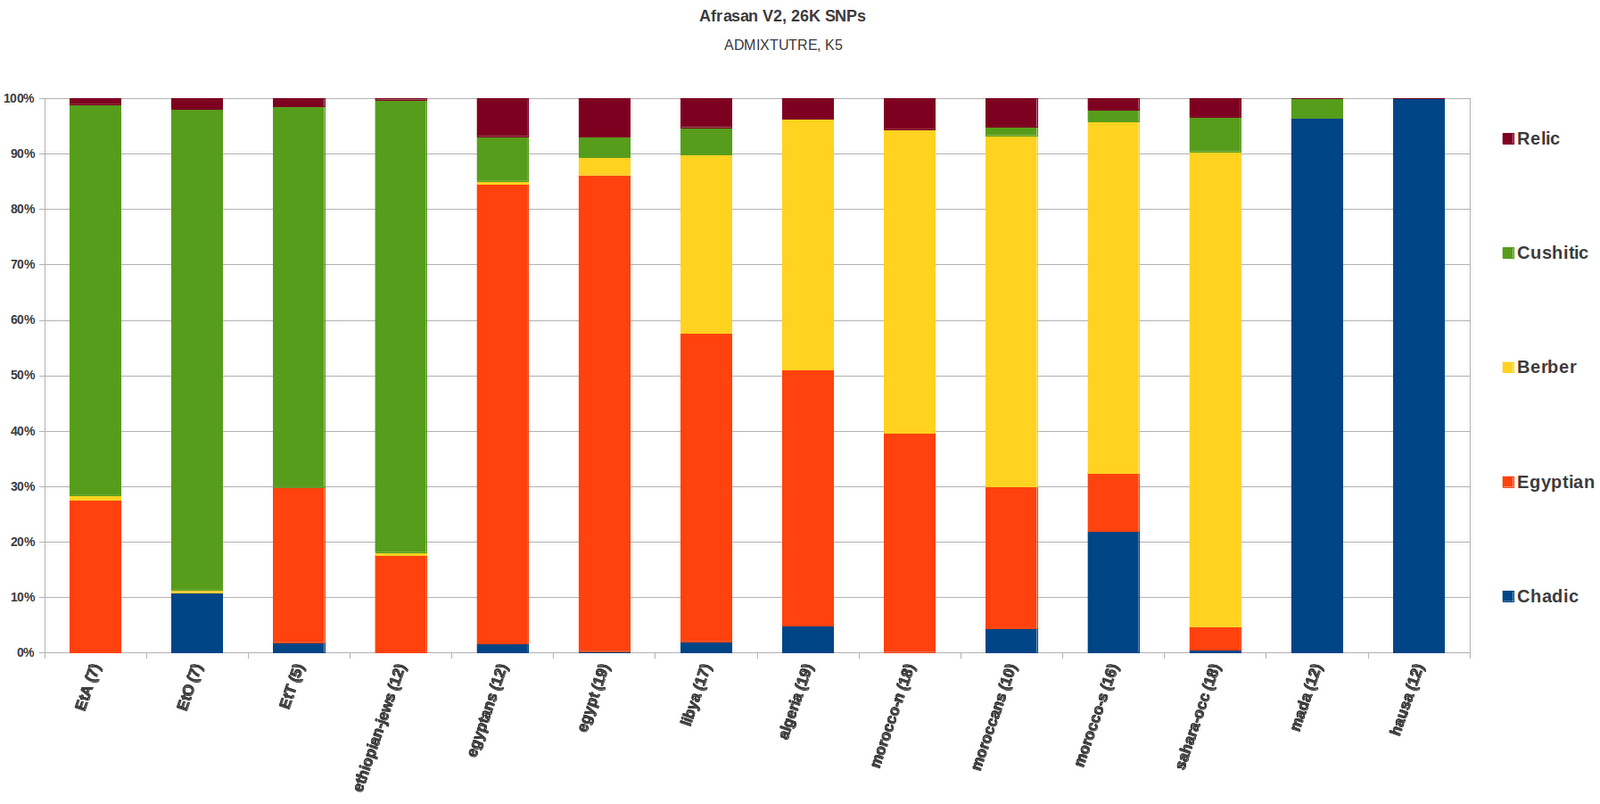
This second iteration of the Afrasan dataset that did not include the Mozabites
created a Cushitic, Chadic, Berber and Egyptian clusters, with a 5th
cluster which looked like a relic that is present in trace amounts in
all the Afrasan samples except the Mada and Hausa. The Egyptian
cluster is also found in highland Ethiopians, it also shows a more frequent occurrence of
high Standard Deviation relative to all the other clusters;

So the Egyptian cluster looks like it
gives less of a linguistic signal than the other clusters, it could
potentially be inclusive of a Semitic signal as well as maybe other
types of non-Afroasiatic Eurasian affinities.
It would be of great interest to see where
Omotic speakears would fit into this analysis.
Subscribe to:
Posts (Atom)

 Posts
Posts


