This is about an observation made when
I introduced the Yemenis (from Behar (2010)) into an ADMIXTURE analysis of the Afrasan Dataset (x Mozabites).
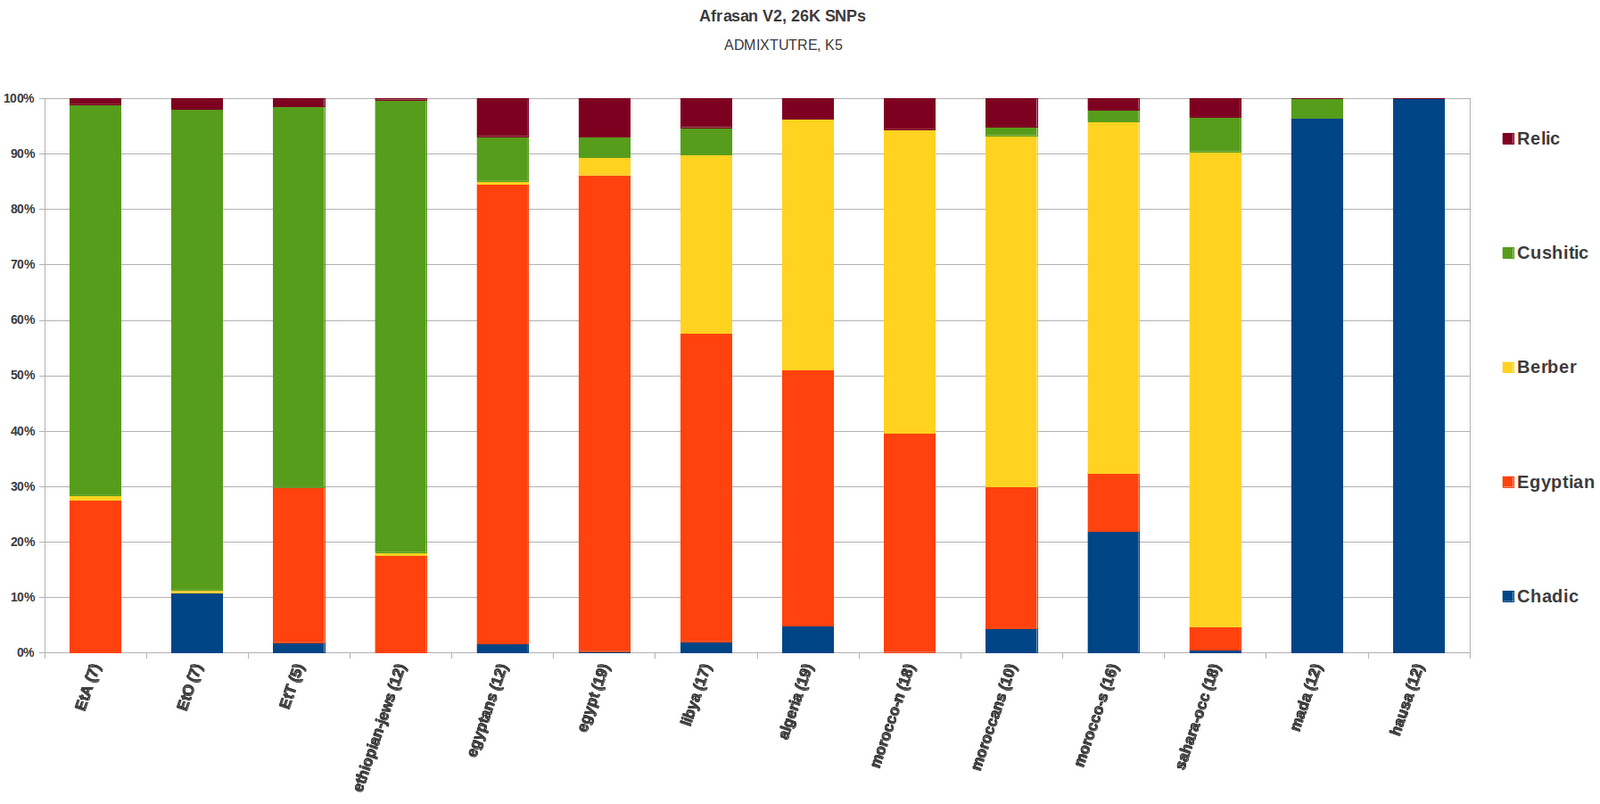
At K=5 the dataset behaves as expected, i.e
similar to the K=5 analysis without the Yemenis, they show a high
amount of the 'Egyptian' cluster, on par with the Egyptians on median,
the remaining cluster distributions were also similar to the K=5
analysis without the Yemenis.

However, the strange thing happens when
you reduce the number of assumed discrete populations by 1 to K=4, a
difference occurs in the results between when the Yemenis are
included and when they are not.


Above, when you run the dataset @ K=4 and
include the Yemenis, the Cushitic cluster now peaks in the
Ethiopian-Jews instead of the EtO samples, the Egyptians and Yemenis
also seem to posses a multi-clustered composition, in almost equal
proportions of both the Berber and Cushitic clusters, with the
previous Egyptian/semitic cluster reduced to a 'relic' cluster.
Another observation is that the remainder of the clusters in the
Ethiopian samples are all, for the most part, affiliated with the
Chadic clusters, however the Cushitic cluster is closest to the
Berber cluster on an Fst basis.
Next, when you look at a K=4 run and
the Yemenis are not included, it is back to the previous observation in a peak of the Cushitic cluster in the EtO samples, along with the
Egyptian cluster being dominant in the Egyptians.


In order to check, either with my result
compiling codes, sample correlation files, or something else was not
wrong with the ADMIXTURE run, I re-run the Afrasan Yemeni inclusive
dataset again @ K=4, only to get the same results. So I do not think
this is an error, something happens with the cluster distributions at
K=4 when the Yemenis are included but disappears back to 'normal' at
K=5, this means that K=2 and K=3 need to be run for both datasets to
get an insight into where this difference in results during the introduction of
Yemenis is arising from.
Update: Taking a look at the K2 and K3 ADMIXTURE analysis for the two datasets, one which includes the Yemenis and the other that doesn't respectively.

 For the Dataset that includes the Yemenis (above), @ K=2, the Chadic speakers are separated from the rest, Ethiopians occupying an intermidiate position but leaning more towards the latter group. @ K=3 a Cluster emerges that peaks in the Ethiopian Jews but is also heavily present in both the Egyptians and the Yemenis.
Update: Taking a look at the K2 and K3 ADMIXTURE analysis for the two datasets, one which includes the Yemenis and the other that doesn't respectively.


For the Dataset that does not include the Yemenis (below), @ both K=2 and K=3 a very similar breakdown of the clusters as above is observed.


Cluster Progression Summary.
V2= w/o Yemenis,


I think that the cluster with the Yemenis is not anymore properly described as 'Cushitic' (hard to imagine 50% of Cushitic influence in Yemen). It's not the same exact component obviously although they do overlap in many of the the alleles that make them up.
ReplyDeleteIt's a curious phenomenon indeed but it may just reflect that the layers of genetic interaction across and along the red Sea are complex and hence the simplification that this kind of analysis unavoidable makes gets blurry.
"I think that the cluster with the Yemenis is not anymore properly described as 'Cushitic' (hard to imagine 50% of Cushitic influence in Yemen"
DeleteI just named it that for consistency with the previous runs, but you are probably right. The lower you go in K the less the naming designations uphold.
"It's a curious phenomenon indeed but it may just reflect that the layers of genetic interaction across and along the red Sea are complex"
Well, the thing is that this cluster that peaked in the Ethiopians Jews also is heavily present in the Egyptians as well, what you said would make sense if it was only present in the Yemenis, also I have updated the K2 and K3 runs for both w and w/o the Yemenis and the phenomenon seems to be observed at lower K values as well.
The Behar et al. Yemenese samples are really poor Arabian references since they contain nontrivial recent South Asian/Persian-like and Bantu admixture. Only sample GSM536550 seems to be an unmixed Yemeni Arab, the rest aren't. The Saudis and Yemenite Jews are generally better Arabian reference samples. There is also some new Qatari data available ( http://bhusers.upf.edu/dcomas/?p=607 ).
ReplyDelete"The Behar et al. Yemenese samples are really poor Arabian references since they contain nontrivial recent South Asian/Persian-like and Bantu admixture."
DeleteI think they are good enough for the purpose of this dataset I am trying to analyse. Besides, who is to say that many or a majority of Yemenis do not have similar genome profiles as those sampled by Behar?
In any event, this Afrasan dataset I have is optimized @ K5, once you go beyond K5, then weird clusters begin to form, for example the Mada and Hausa form completely different clusters on their own @K6, so I believe K5 is a good limit for this dataset, and @ K5 these Yemenis look very similar to the largely uni-clusteral Egyptian profile, the question is why at K4 or less this mono-cluster does not form, especially when the Yemenis are included and also the K3 cluster emergence and peak in the EtJ samples that then becomes the 'cushitic' cluster, do you have any opinions about that?
Well, we are trying to look at ancient events here, so recently admixed samples who fall of a certain cline can disrupt analyses. Since there aren't any East Asian/Bantu/Indian populations included here, so samples admixed with them can behave strangely. The Yemenite Jews and certain Saudi samples are probably the most useful Arabian references collected so far. I would prefer them being used in these type of analyses.
DeleteAs for the oddities at K=4 v2/v3. I think the program may have picked up some shared elements across the red sea which matched each other slightly better than the geographically distant Delta Egyptian samples? Generally speaking the more samples the more stable the results are.
You might also want to add Armenians as a proxy for Assyrians and the Northern Middle East in general. And perhaps the Samaritans.
DeleteFor the North cluster of West Asians, Kurds appear to be the less noisy sample (Assyrians are such an inbred minority that I consider them along Druzes and Jews and generally exclude it).
DeleteIf you want to analyze NW Africans specifically, I would include an Iberian sample, because NW Africans have a lot of Iberian-derived mtDNA (some Y-DNA too). Either Spain or Basques. Spain is more probably the true origin but Basques appear to have much less Trans-Mediterranean admixture.
Based on the K5 ADMIXTURE run of the Afrasan_V3 dataset , which included the Yemenis, I studentized the output of that run to detect any outliers, studentize > 2, meaning for each sample in the assigned population, subtract the mean for the cluster found in the particular population from each sample and then divide it by the population specific standard deviation of the cluster, this filtered out 33 samples from the dataset that did not pass the test:
Delete0 GSM537030 EtA
Algeria ALGF algeria
Algeria ALGG algeria
Egypt 5AJ137 egypt
Egypt 3AJ137 egypt
0 GSM536568 egyptans
0 GSM536573 egyptans
0 GSM536575 egyptans
0 GSM536664 ethiopian-jews
0 GSM536666 ethiopian-jews
0 GSM536670 ethiopian-jews
Hausa NGHA017 hausa
Libya LIB16 libya
Libya LIB33 libya
Libya LIB51 libya
Mada CAMD013 mada
Mada CAMD003 mada
0 GSM536957 moroccans
0 GSM536958 moroccans
Morocco_N MOJ2 morocco-n
Morocco_N MCH16 morocco-n
Morocco_N MCH18 morocco-n
Morocco_N MCH12 morocco-n
Morocco_N MNA9 morocco-n
Morocco_S ERR20 morocco-s
Morocco_S MOU15 morocco-s
Morocco_S ERR11 morocco-s
Sahara_OCC SAH2 sahara-occ
Sahara_OCC SAH22 sahara-occ
Sahara_OCC SAH8 sahara-occ
Sahara_OCC SAH58 sahara-occ
0 GSM536541 yemenese
0 GSM536545 yemenese
After taking out these samples from the dataset and rerunning ADMIXTURE, K5 , the results came out pretty much the same but for a few minor differences as when those samples were included, and with the Yemenis peaking again for the same cluster they peaked in before the modification of the dataset.
The purpose of this exercise is to find substructure in Afroasiatic speaking populations that maybe analogous to the traditional classification of the Afroasiatic languages, the Yemenis as an Afroasiatic speaking population (semitic) are as good a proxy for non-African Afroasiatic speakers as any one else.
It off-course doesn't mean that the cluster found in them is unique to only semitic speakers, or that the cluster found in the Berbers is unique to only Berbers and does not harbor, for instance, an Iberian like element and so forth......
Check out these population portraits:
DeleteYemen Jews
http://i.imgur.com/nmaZo.png
Yemenese (Arabs)
http://i.imgur.com/Z8mun.png
^ Notice the nontrivial West-Central African and elevated South Asian admixture in the latter.
This could not have come natively from the other side of the Red Sea.
Somalis:
http://i.imgur.com/8vK3K.png
Ethiopians:
http://i.imgur.com/z3zjU.png
Ethiopian Jews:
http://i.imgur.com/6XWD4.png
Therefore we can conclude that Yemenite Jews represent ancient Yemenis better than those Yemenese Arab samples.
I seldom relate genetics and language, so I did not realize that you were analyzing only Afroasiatic speakers. Sorry about that.
ReplyDeleteYeah Language and Genetics don't always overlap, this is the case when genes overlap much stronger with geography, in other cases however language and genes do correlate, and the geographical correlation becomes weaker, here are some sources for different areas in the world showing some correlation between genes and language. I am sure there are newer sources, so I need to update this list.
ReplyDeleteFor Africa:
Tishkoff (2009), The Genetic Structure and History of Africans and African Americans, Science 22 May 2009: 324 (5930), 1035-1044.Published online 30 April 2009 [DOI:10.1126/science.1172257]
For Europe:
-Piazza A, et al. (1995) Genetics and the origin of European languages. Proc Natl Acad Sci USA 92:5836–5840.
-Cavalli-Sforza L, Feldman M (1981) Cultural Transmission and Evolution (Princeton
Univ Press, Princeton).
For Asia:
-Karafet T, et al. (2001) Paternal population history of East Asia: Sources, patterns, and microevolutionary processes. Am J Hum Genet 69:615–628.
For the Pacific:
-Friedlaender JS, et al. (2008) The genetic structure of Pacific Islanders. PLoS Genet 4:e19.
-Scheinfeldt L, et al. (2006) Unexpected NRY chromosome variation in Northern Island Melanesia. Mol Biol Evol 23:1628–1641.
-Merriwether DA, et al. (1999) Mitochondrial DNA variation is an indicator of austronesian influence in Island Melanesia. Am J Phys Anthropol 110:243–270.
-Robledo R, Scheinfeldt L, Merriwether DA, Thompson F, Friedlaender J (2003) A 9.1- kb insertion/deletion polymorphism suggests a common pattern of genetic diversity in Island Melanesia. Hum Biol 75:941–949.
For the Americas:
-Eshleman JA, et al. (2004) Mitochondrial DNA and prehistoric settlements: Native migrations on the western edge of North America. Hum Biol 76:55–75.
-Malhi RS, Schultz BA, Smith DG (2001) Distribution of mitochondrial DNA lineages among Native American tribes of Northeastern North America. Hum Biol 73:17–55.
-Smith DG, et al. (2000) Implications of the distribution of Albumin Naskapi and Albumin Mexico for new world prehistory. Am J Phys Anthropol 111:557–572.
-Wang S, et al. (2007) Genetic variation and population structure in native Americans. PLoS Genet 3:e185.