The pdf can be downloaded here
Regarding the populations sampled, the
paper notes the following:
“The
high altitude (HA) Amhara are agropastoralists living in a temperate
Afro-alpine ecosystem in the Simien Mountains National Park at
altitudes ranging from 3500-4100 meters (m). Altitudes above 2500m on
the East African Plateau have been inhabited for at least 5 thousand
years (ky) and altitudes around 2300-2400m for more than 70ky
[24,25].”
Plus:
“DNA
was extracted from blood samples provided by 192 Amhara individuals
living at 3700 m in the Simien Mountains National Park or at 1200 m
in the town of Zarima.”
For
the Oromo:
“The
HA Oromo are pastoralists herding cattle, sheep and goats and living
in a temperate Afro-alpine ecosystem in the Bale Mountains National
park and reside on the Sanetti Plateau at 4000-4100m. The HA areas of
the Bale Plateau have been inhabited by Oromo since the early 1500s
according to historical records [22,23].”
Plus:
“79
individuals lived at 4000 m in the Bale Mountains National Park while
39 individuals lived at 1560 m in the town of Melkibuta.”
Melkibuta
is probably a typo for Melkabuta, Bale, close to Goro, Bale which I
have used as a proxy town in the map below for the location of the LA Oromo samples.
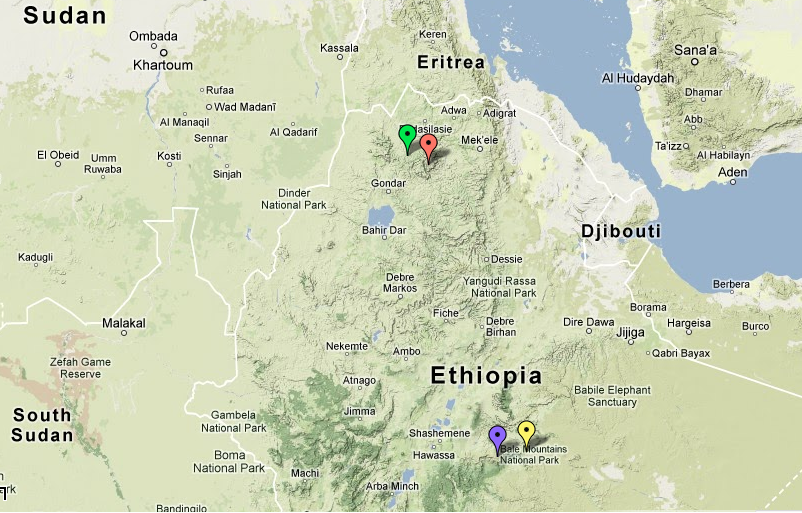 |
| Green= Low Altitude Amhara, Orange = High Altitude Amhara , Yellow = Low Altitude Oromo, Purple = High Altitude Oromo |
Regarding
the STRUCTURE run it says:
“This
position is further supported by the Bayesian clustering analysis
performed using the program STRUCTURE [85]. In this analysis, 3
different sets of 57652 SNPs were used to infer the ancestral
composition of each population assuming 7 ancestral groups. The
STRUCTURE plots clearly show that Ethiopian populations share
ancestral components with sub-Saharan African and Middle Eastern
populations falling in the middle of the ancestry gradient between
these two groups of populations (Figure S2.”
and
Interestingly:
“We
also calculated the haplotype diversity and compared it to that
observed in the worldwide populations. Interestingly, the Oromo
(0.822) and Amhara (0.810) haplotype diversity values are as high as
or higher than the highest values [80] observed in the HGDP, i.e.
Bantu (0.818), Biaka Pygmies (0.815), Yoruba (0.815) and Mandenka
(0.807); this is true regardless of altitude (0.798 for HA Amhara;
0.803 for LA Amhara, 0.813 for HA Oromo, and 0.813 for LA Oromo).”
There
is also an FsT based Global neighbor joining tree in the PDF with a
familiar outcome.


UPDATE: As far as the 7 clusters found in this global STRUCTURE run;
Cluster 1 (Blue) : Dominates in Sub-Saharan Africa, peaking in the hunter gatherers, AKA, Pygmy and Khoisan (Amhara ~28% , Oromo ~ 35%, Maasai ~ 56% )
Cluster 2 (Purple) : Dominates mostly in the Ethiopian and Maasai samples, but also found in North Africa, Near-east and West Africa in fairly significant amounts. (Amhara ~44% , Oromo ~ 44%, Maasai ~ 38% )
Cluster 3 (Green) : Dominates in West Asia / Europe, with a peak in the Sardinians. (Amhara ~28% , Oromo ~ 21%, Maasai ~ 6% )
Cluster 4 (Orange) : Dominates in South Asia, peaking with the Gujarati samples.
Cluster 5 (Teal) : Dominates in East Asia.
Cluster 6 (Light Blue) : Dominates with Native Americans.
Cluster 7 (Brown) : Dominates with Oceanians.
Unfortunately the K=2 to 6 runs have not been reported, making it hard to gauge how this particular dataset would stack up relative to other global datasets.
UPDATE2: Comparing with ADMIXTURE.
Here, I compare the cluster breakdowns
(or peaking populations) of the Global STRUCTURE run of this post,
with the clusters formed in the ADMIXTURE global K=7 runs I have done
in the past on two separate datasets, both datasets can be
downloaded from here.
Dataset 1, Global, K= 7, Without
Pagani 2012 East African Samples.
Cluster1:
sardinian,basque,spaniards,italian,tuscans
Cluster2: dogon,yoruba,bambaran,hausa,igbo
Cluster3:
irula,tn-dalit,ap-mala,ap-madiga,north-kannadi
Cluster4: san-nb,san,!kung,pygmy,mbutipygmy
Cluster5:
papuan,melanesian,tongan,samoan,paniya
Cluster6:
colombian,surui,karitiana,pima,totonac
Cluster7:
she,han,chinese-americans,singapore-chinese,chinese
Dataset 2, Global, K= 7 , With Pagani
2012 East African Samples.
Cluster1:
papuan,irula,tn-dalit,ap-mala,ap-madiga
Cluster2:
sardinian,basque,spaniards,italian,tuscans
Cluster3:
san-nb,san,!kung,pygmy,mbutipygmy
Cluster4:
colombian,karitiana,surui,pima,totonac
Cluster5:
she,chinese,han,chinese-americans,singapore-chinese
Cluster6:
yoruba,dogon,brong,igbo,bambaran
Cluster7:
ARI-B,ARI-C,Gumuz,Somali,EtS-P
The clusters highlighted in yellow are
clusters also found by the STRUCTURE run of this post (at least
roughly), the main differences are in the African clusters, while
ADMIXTURE split the African clusters between a West African, Hunter
Gatherer and East African (only in the case of the Pagani inclusive
samples), the STRUCTURE run did not find 3 but rather only 2 African
components, instead, as a compensation it split the Oceanians from
the South Asians. There can only be three explanations to these
differences in results:
- The SNPs used are from different regions of the genome
- The way STRUCTURE splits components is different from ADMIXTURE
- The difference in sampling of the global datasets (of which those of the ADMIXTURE runs were more complete)
Or all 3 could be true with varying
degrees of impact. The only way to verify is by running ADMIXTURE
with a global dataset similar to the one in this post.


No comments:
Post a Comment