Continuing with the Intra-African genome-wide analysis, I wanted to further explore the 'North African'
Cluster that appeared to be wide spread from East to North and West
Africa, 408 individuals out of the 1065 total samples carried the
North African cluster at a frequency greater than 5%. With some of
these populations showing a relatively high Standard deviation
(Normalized with N-1) for that particular cluster.
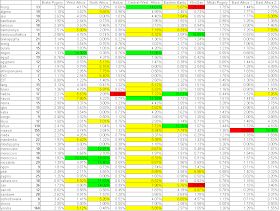
The table below shows the Standard
Deviation for each of the 10 clusters found in the Intra-African Genome-Wide Analysis.
Yellow; Moderate Standard Deviation,
5-10%
Green; High Standard Deviation, 10-20%
Red; Very High Standard Deviation, >20%
The North African cluster had a high
standard deviation in the Sahara-OCC, Morrocans, SAN, Mozabite and
Morroco-S populations. All of these populations however, excluding
the SAN, carried the North African cluster, on Median, in very high
proportions (> 69%), while the SAN had it on Median only at ~4%.
18 out of the 36 SAN samples did however carry the North African
cluster anywhere between 5-56%. Therefore, I excluded these 18
samples from the 408 individuals who carried the North African
cluster at greater than 5% and proceeded to create a Dataset with
PLINK.
The North African Cluster Dataset
thus included 390 individuals (plus a few private samples) typed at 26,129
SNPs (all other specifications held constant with the previous Dataset).
MDS Analysis
Here below are the MDS plots for the
Dataset, the plots include a 3 Dimensional plot, C1 Vs. C2 plot and
C1 vs. C3 Plot respectively.
The 1St component separates North
Africans from the rest, with Ethiopians and Fulanis located at an
intermediate position in this separation. The
2nd component
separates West Africans from the rest, with Bantus (Kenya and South
Africa) located at an intermediate position in this separation. The
Last and 3rd component separates the Sandawe from
everybody else.
Model Based Analysis.
5 clusters were generated from this
dataset using ADMIXTURE, K=5, Unsupervised. A cluster that peaked in
the Fulani, one cluster that peaked in the Mozabites, another cluster
that peaked in the Sandawe, a fourth cluster that peaked in the
Maasai, which I named East African, and a Last cluster that peaked in
the Egyptians, which I named North East African, were observed. A PCA
for the Fst distances that were generated by ADMIXTURE for these
clusters can be seen below.
The largest vectorized Fst distance is seen for the Fulani, both for components 1&2, while the East African
and Sandawe clusters appear to be close, similar to how the Mozabite
and North East African clusters are close.
A standard deviation table (Normalized
with N-1) for the 5 clusters generated can be seen below.
The Highest Average Standard Deviation
across populations for the five clusters was among the Southern
Morrocans and Mozabites (10.61 and 11.7% respectively).
Above are the Median proportions for
all five clusters in the dataset.
The Mozabite cluster tapers off in a
direction going east from the Northwest of Africa, where it is found at
moderate frequencies in Egypt (~10%), the same can be said of the
Fulani cluster, i.e tapering off in an eastward direction from
Western Africa and found at a moderate (~6%) frequency in the
Sandawe. The Sandawe cluster seems to be restricted to East Africa,
although relatively high frequencies of it can also be seen in
Southern Africa. The East African cluster, which peaks in the Maasai,
is observed throughout East, West and Southern Africa. Finally, the
North East African cluster merges North Africa with East Africa, for
which a major portion can be accounted for with bi-directional Nile
Corridor migrations, in addition to populations that used
to live in the Sahara at a time when the desert was habitable. Minor,
but gradiently significant Extra African input in the formation of
the Mozabite and North East African clusters can also not be ruled
out.


How can you hope to achieve meaningful results without including European and Middle Eastern samples?
ReplyDeleteAfrica holds its own when it comes to genetics, unlike other continents it is the origin of all human beings, including Europeans and Middle Easterners, this is why on a global PCA plot we will always see the first principal component, i.e. the component which describes the highest variation, separating Africans from non Africans first and foremost, which makes it worthwhile to study African genetics in its own right. With respect to detecting Eurasian Admixture in Africans, North Africans can act like a sort of proxy........
DeleteWhen West Asians are added Egyptians mainly seem derived from clusters peaking elsewhere (West Asia/East Africa). While Berbers (Mozabites) are generally more distinctive in these analyses.
ReplyDelete