Cruciani et. al 2004, is perhaps the best comprehensive study that we currently have with respect to the signature paternal haplogroup that is most abundant among males of Eastern and Northern Africa, E1b1b.
The haplogroup is most likely of indigenous Eastern African origin according to the paper:
We obtained an estimate of 25.6 thousand years (ky) (95% CI 24.3–27.4 ky) for the TMRCA of the 509 haplogroup E3b chromosomes, which is close to the 30 +/-6 ky estimate for the age of the M35 mutation reported by Bosch et al. (2001) using a different method. Several observations point to eastern Africa as the homeland for haplogroup E3b—that is, it had (1) the highest number of different E3b clades (table 1), (2) a high frequency of this haplogroup and a high microsatellite diversity, and, finally, (3)the exclusive presence of the undifferentiated E3b* paragroup.
Note: E3b here refers to the Y- DNA lineage that is defined by E-M215 (as seen below taken from Figure 1) and is referred by current nomenclature as E1b1b.
1) E1b1b (E-M215) frequencies in East African populations.
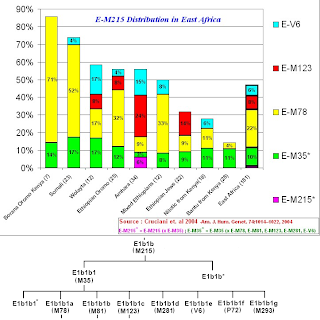

The paper states that the Kenyan Bantu data comes from "Human Genome Diversity Project/CEPH DNA panel (Cann et al. 2002)", while I have not (as of yet) seen the precise data, one can speculate that the majority of the E-M96 lineages that are non E-M215 found in the Kenyan Bantu probably belong to E1b1a (E-M2).
The paper also states that for the Ethiopian Jews (A.K.A Bete Israel) the data comes from "Cruciani et al. 2002", from this paper we can glean that the lineages described as E-M96 but not downstream of E-M215, all belong to E3* (x E-M2), which in current nomenclature would translate to E1b1* (E-PN2*), while noting that a slight chance exists that said lineages could belong to the later found subclade of E1b1 now known as E1b1c (E-M329).
Unfortunately, for the sampled populations (other than the Kenyan Bantu and Ethiopian Jews), no further data is given to clarify the composition of the E-M96 (x E-M215) lineages.
3) Breakdown of the 515 E-M215 lineages found in this study.

The haplogroup is most likely of indigenous Eastern African origin according to the paper:
We obtained an estimate of 25.6 thousand years (ky) (95% CI 24.3–27.4 ky) for the TMRCA of the 509 haplogroup E3b chromosomes, which is close to the 30 +/-6 ky estimate for the age of the M35 mutation reported by Bosch et al. (2001) using a different method. Several observations point to eastern Africa as the homeland for haplogroup E3b—that is, it had (1) the highest number of different E3b clades (table 1), (2) a high frequency of this haplogroup and a high microsatellite diversity, and, finally, (3)the exclusive presence of the undifferentiated E3b* paragroup.
Note: E3b here refers to the Y- DNA lineage that is defined by E-M215 (as seen below taken from Figure 1) and is referred by current nomenclature as E1b1b.

1) E1b1b (E-M215) frequencies in East African populations.

It's important to note here that after the publishing of this paper, a new SNP downstream of E-M35 and parallel to E-M78, E-M81, etc... was found by Henn et. al 2008, this new sub lineage of E1b1b1 (E-M35) was coined as being E1b1b1g (E-M293), therefore, some of the lineages labeled as E-M35* above could indeed turn out to be part of this newly discovered lineage, however, this is unlikely because E-M293 is more predominent in areas further south from the Horn of Africa according to Henn et. al.
2) E-M96 (xM215) + E-M215 with down stream clades

E-M96 is the upstream ancestor, 3rd node up (including the E-M215 node), of E1b1b. It is the macro haplogroup which includes some 70% of the male lineages found on the African continent.
The purpose of the above graphic is to give a general sense of the ratio of E lineages without the E-M215 mutation to that of E lineages with the E-M215 mutation for populations in East Africa.
Notice that this ratio is at a Maximum (~5.3) for "Bantus from Kenya", while it is at a Minimum (0) for "Somalis", while the average for all the Eastern African populations sampled is ~0.5.The paper states that the Kenyan Bantu data comes from "Human Genome Diversity Project/CEPH DNA panel (Cann et al. 2002)", while I have not (as of yet) seen the precise data, one can speculate that the majority of the E-M96 lineages that are non E-M215 found in the Kenyan Bantu probably belong to E1b1a (E-M2).
The paper also states that for the Ethiopian Jews (A.K.A Bete Israel) the data comes from "Cruciani et al. 2002", from this paper we can glean that the lineages described as E-M96 but not downstream of E-M215, all belong to E3* (x E-M2), which in current nomenclature would translate to E1b1* (E-PN2*), while noting that a slight chance exists that said lineages could belong to the later found subclade of E1b1 now known as E1b1c (E-M329).
Unfortunately, for the sampled populations (other than the Kenyan Bantu and Ethiopian Jews), no further data is given to clarify the composition of the E-M96 (x E-M215) lineages.
3) Breakdown of the 515 E-M215 lineages found in this study.

This paper serves as a benchmark for E1b1b, since it did the most extensive study of the lineage on a global level:
"We explored the phylogeography of human Y-chromosomal haplogroup E3b by analyzing 3,401 individuals from five continents."
Out of the 3,401 individuals, 515 or 15.1% were found to belong to E1b1b (E-M215) :
Out of the 3,401 individuals, 515 or 15.1% were found to belong to E1b1b (E-M215) :
"Five hundred fifteen haplogroup E3b subjects were identified and further analyzed for the biallelic markers M34, M78, M81, M123, M281 (Underhill et al. 2000; Seminoet al. 2002), and V6."
It should be noted again that the 9% of E-M35* lineages found include those also found in Southern Africa among the Kung, Khwe and Bantu, but as stated above, these E-M35* lineages probably belong to the later found subclade E-M293 per the Henn et. al 2008 paper, in that event the share of E-M35* lineages found would probably drop by ~3%.
4) Microsatellite Networks for the main sub-lineages and E-M35*

(taken from Figure 2):
Microsatellite networks of E3b haplogroups. A, E-M35*. B, E-M78. C, E-M81. D, E-M34. Reduced-median and median-joining procedures (Bandelt et al. 1995, 1999) were applied sequentially. A haplogroup-specific weight proportional to the reciprocal of microsatellite variance was used in the construction of the networks. The E-M78 unweighted network (not shown) gave the same quadripartite structure. Unassigned chromosomes (B) showed an intermediate position between clusters "alpha" and "delta" in the unweighted network. Microsatellite haplotypes are represented by circles, with areas proportional to the number of individuals harboring the haplotype. Branch lengths are proportional to the number of one-step mutations separating two haplotypes.
The Alpha, Beta, Delta and Gamma clusters of E-M78 found in this study were investigated later in Cruciani et. al 2007 and were assigned to a new set of SNP's downstream of E-M78 known as the V-series. As a matter of fact, the sole focus of Cruciani et. al 2007 with respect to E lineages was on E-M78.
5) Comparing Cruciani '04 results to the E3b Project

The E3b project, has an on going and a real time database of people who have tested positive for the E-M35 lineage and further downstream sub-lineages. As such, it is a good tool for testing the findings of Cruciani '04. Above, you can see such a test done by me comparing the relative frequency of E-M35 subclades found in Cruciani '04 to that of the E-M35 deep clade test results from the E3b project as of October 2009.
Further peer reviewed sources on E1b1b and it's subclades can be found below:

Table above taken from : A review paper on E-M35 by Andrew Lancaster 2009


No comments:
Post a Comment